
|
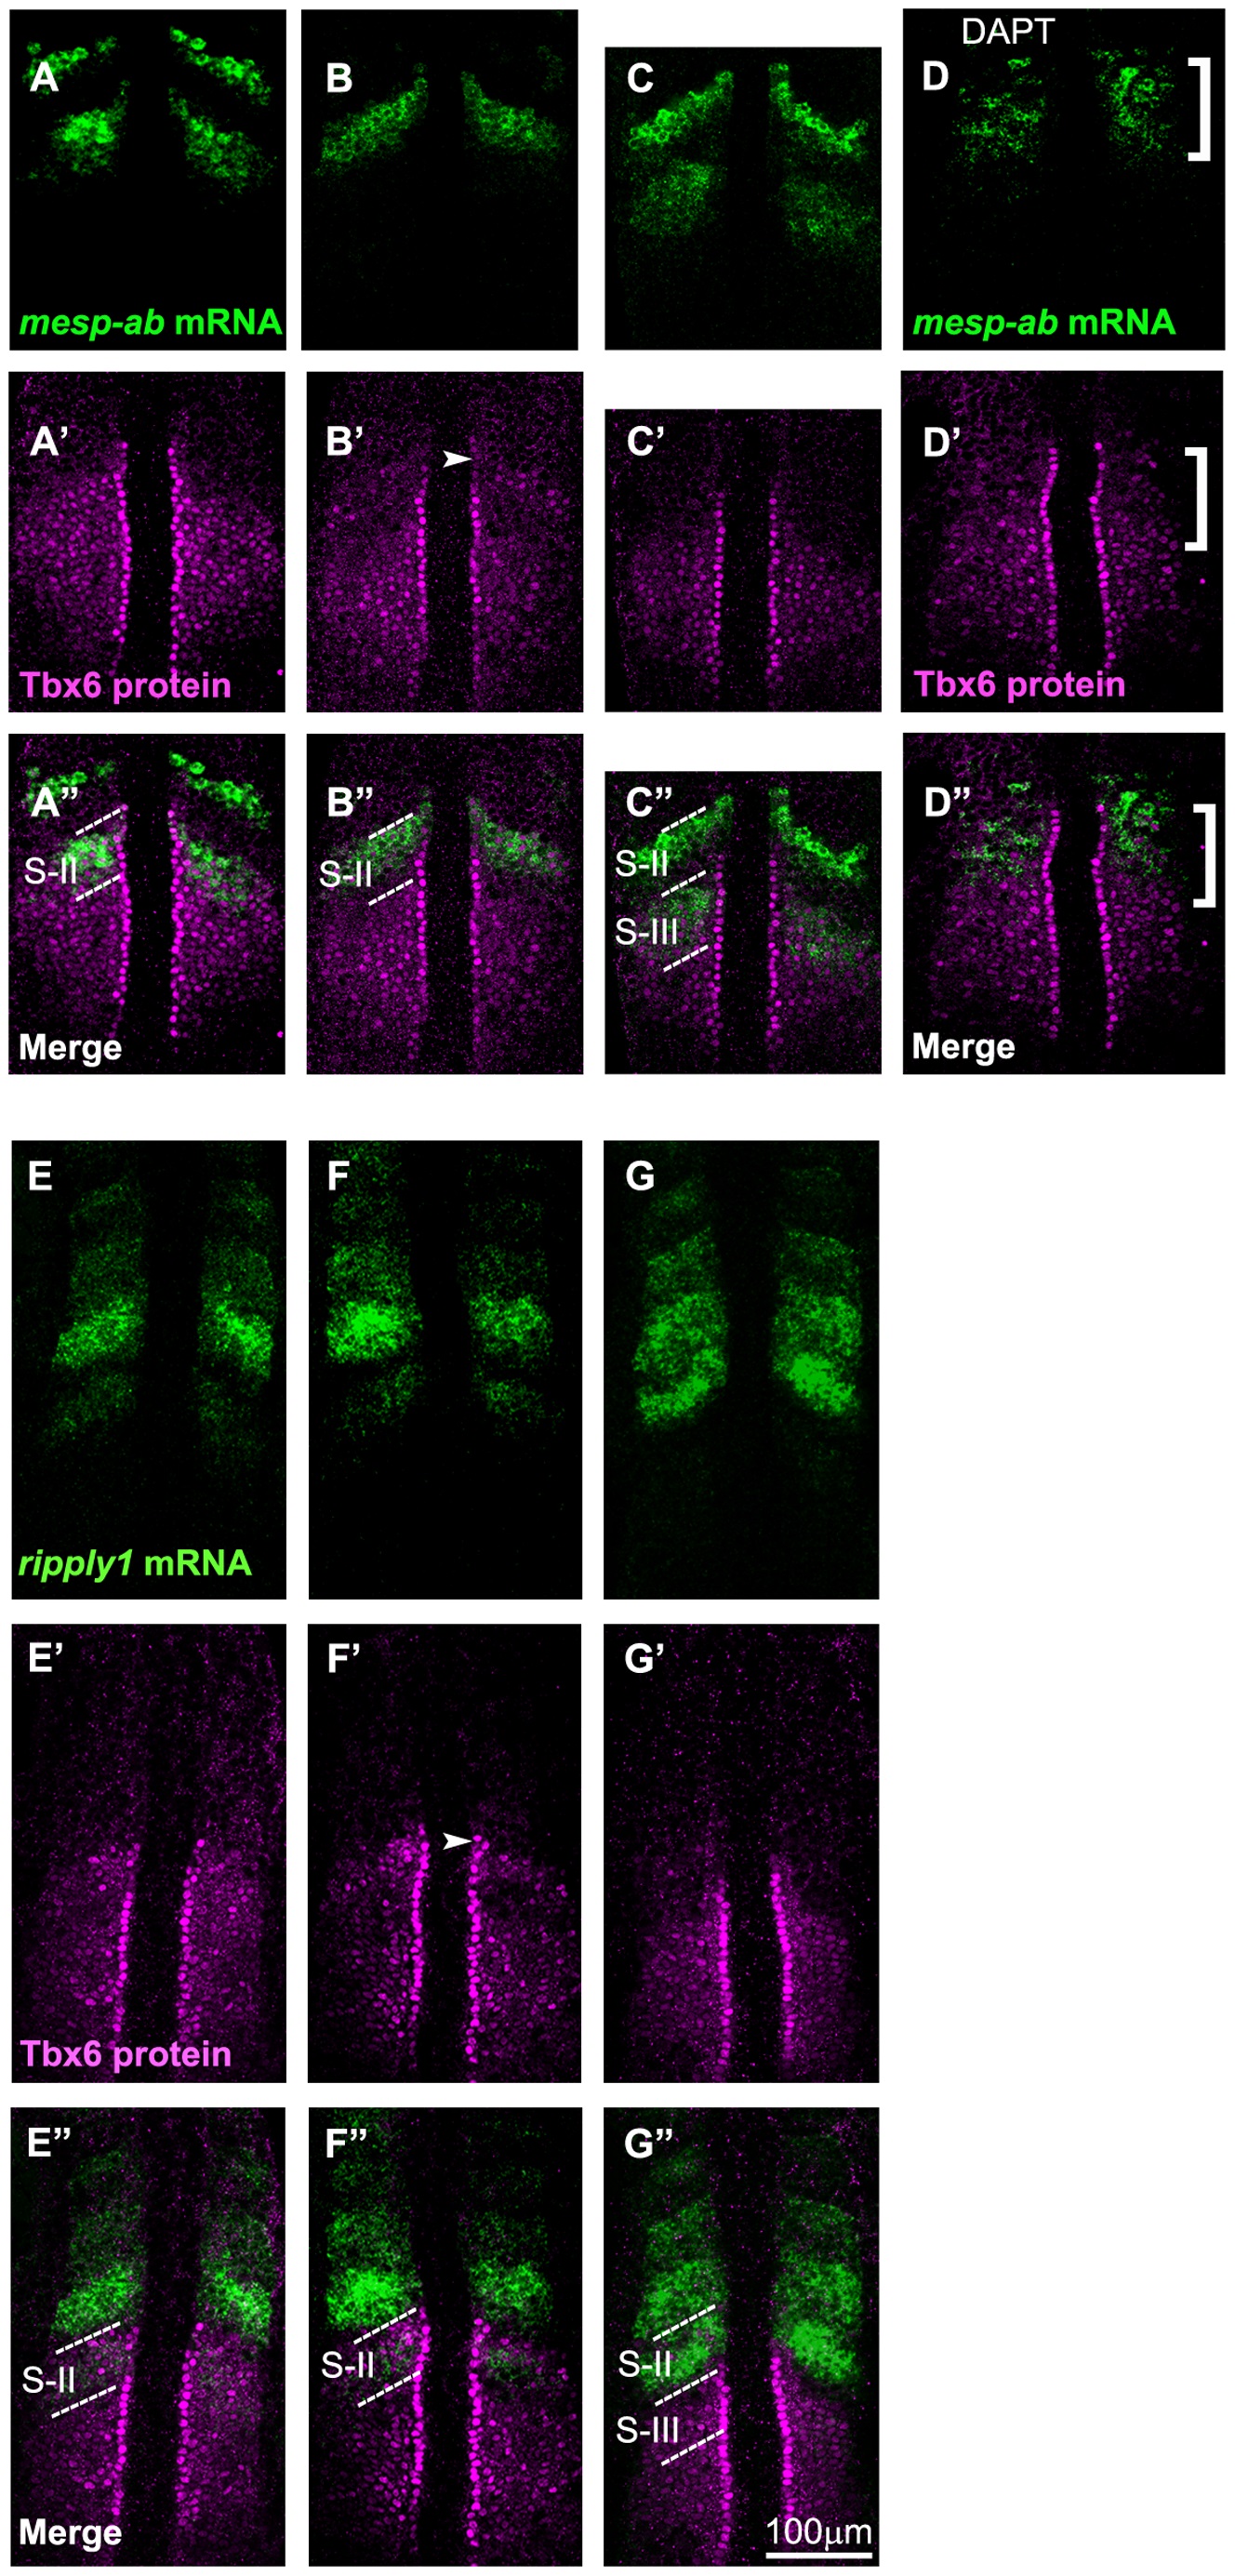
Fig. 3
Comparative analysis of the anterior border of the Tbx6 domain with expression of mesp and ripply. Spatial pattern of the Tbx6 protein (magenta) is compared with those (green) of mesp-ab mRNA (A-D) and ripply1 mRNA (E-G) at 3 different phases of segmentation cycle (the phases in embryos shown in A, B, or C are identical to those shown in E, F, or G, respectively) at around the 8 somite stage. Tbx6 pattern was also compared with mesp-ab mRNA in embryos treated with DAPT (D). Merged images are indicated (A′′-G′′). Out of a total of 59 embryos examined, around 46.5% of them showed A and E phase, 27% showed B and F phase, 26.5% showed C and G phase type of expression. Note that the anterior limit of newly expressed, or most posterior, mesp-ab band coincided with the anterior border of the Tbx6 core domain (A-A′′). Then, this expression coincided with the upper band of Tbx6 when elimination of the anterior Tbx6 domain started (B-B′′). On the other hand, new ripply1 expression emerged within the anterior part of Tbx6 domain (E-E′′) and the Tbx6 domain starts to vanish in area where ripply1 was expressed (F-F′′). In (D), the defects were observed in all of the embryos treated with DAPT (n = 22). Patterns of Tbx6 proteins and mesp-ab mRNA were disturbed in anterior area indicated by a bracket. The dotted lines indicate S-II (A′′, B′′, E′′, F′′) and, S-II and S-III (C′′, G′′) regions.