
Image
|
Figure Caption
Fig. S5
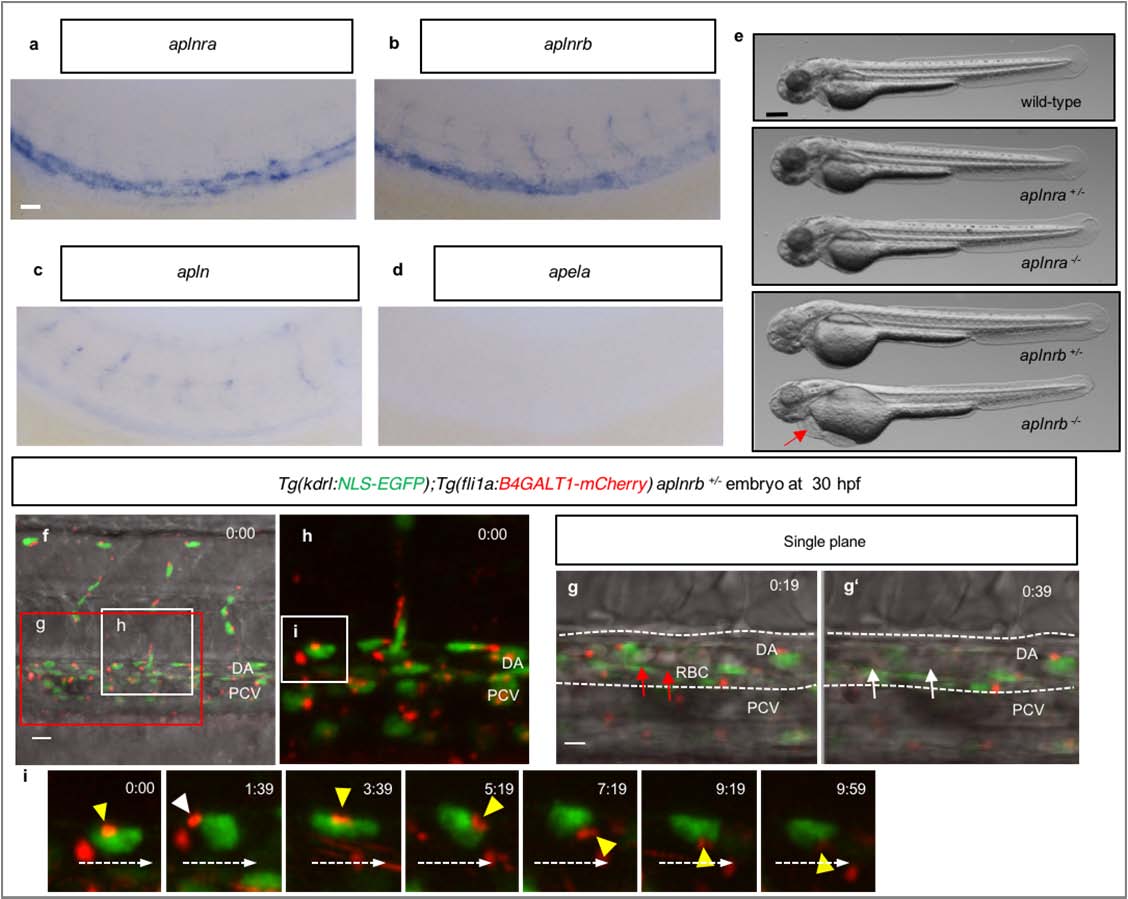
aplnrb modulates endothelial cell polarization.
(a-d) in situ hybridization of 48 hpf wild-type embryos for aplnra (a), aplnrb (b), apln (c) and apela (d) expression. (e) Bright field images of 60 hpf wild-type, aplnra +/-, aplnra -/- , aplnrb +/- and aplnrb -/- embryos. (f-g′) 3D-rendered confocal stack images of a 72 hpf Tg(kdrl:NLS61 EGFP);Tg(fli1a:B4GALT1-mCherry) aplnrb +/- larva. The white box in (f) is enlarged in (h) and the single plane images of the red box in (f) are enlarged in the right panels (g, g′). (g, g′) At t=0:19, red blood cells (RBCs, red arrows) in the DA are mainly stationary whereas by t=0:39 (39 mins) they are moving too fast to be clearly distinct (white arrows). (i) Time-lapse confocal images of DA ECs in the white box in (h). White dashed arrows indicate the direction of blood flow. White arrowheads point to polarized ECs, yellow arrowheads to non-polarized ECs. Time (hours:mins) is shown in the top right corner of the images. Anterior to the left, dorsal to the top. Scale bars, 40 µm (a-d), 100 µm (e), 20 µm (f-i). DA, dorsal aorta; PCV, posterior cardinal vein.
Figure Data
Acknowledgments
This image is the copyrighted work of the attributed author or publisher, and
ZFIN has permission only to display this image to its users.
Additional permissions should be obtained from the applicable author or publisher of the image.
Full text @ Nat. Commun.