
Fig. 4
- ID
- ZDB-IMAGE-160523-5
- Genes
- Publication
- de Bruin et al., 2016 - Genome-wide analysis reveals NRP1 as a direct HIF1α-E2F7 target in the regulation of motorneuron guidance in vivo
- All Figures
- Figures for de Bruin et al., 2016
|
Fig. 4
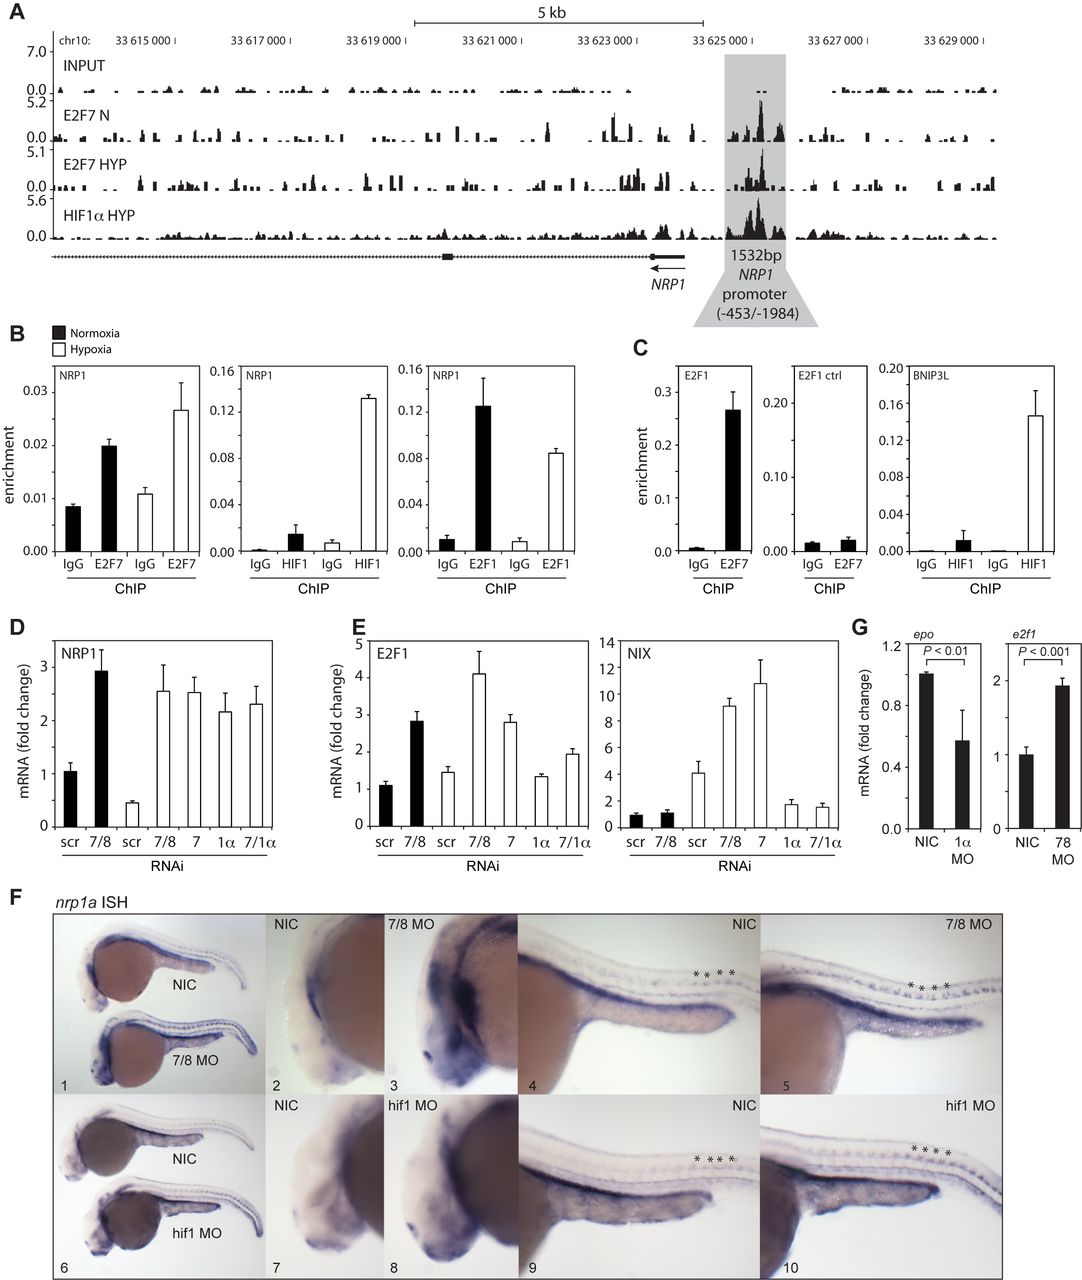
In vitro and in vivo validation of NRP1 regulation by HIF1α and E2F7. (A) ChIP-seq signal (y-axis: peak height) shown for E2F7 (N and HYP) and HIF1α (HYP) on the NRP1 promoter (indicated in grey). Input DNA was sequenced as a control. Lines underneath the graphs indicate annotated genes, boxes present exons and lines with arrows indicate introns. Arrow indicates direction of transcription. (B) Validation of HIF1α, E2F7 and E2F1 enrichment on the NRP1 promoter as analyzed by ChIP-qPCR in normoxic or hypoxic HeLa cells. Isotype matched IgG served as a negative control. (C) Positive controls for ChIP: binding of E2F7 to the E2F1 promoter, and HIF1α binding to the BNIP3L promoter. A non-specific region 700 bp upstream of the E2F binding site in the E2F1 promoter served as a negative control. (D) Graph shows NRP1 mRNA levels as determined by qPCR in lysates isolated from HeLa cells transfected with control (scr), E2F7 and E2F8 (7/8), E2F7 (7), HIF1α (1α) or E2F7 and HIF1α (7/1α). (E) Same as (D) but now for E2F1 and NIX mRNA levels, positive controls for E2F7 and HIF1α, respectively. (F) In situ hybridizations (ISH) for nrp1a using non-injected control (NIC), e2f7/8 MO (5 + 5 ng, n = 46), or hif1ab MO (5 ng, n = 70) injected zebrafish embryos, obtained from three independent experiments. e2f7/8 MO and NIC littermates were analyzed at 26 hpf, hif1ab MO injected and NIC littermate embryos at 28 hpf. 100% of the e2f7/8 MO injected embryos, and 69% of the hif1ab MO injected embryos showed enhanced nrp1a expression in MN. All panels show lateral views. Panels 2, 3, 7 and 8 show magnifications of the head region. Panels 4, 5, 9 and 10 show magnifications of the trunk region. Asterisks show examples of spinal motorneurons. (G) Graphs show fold change of epo or e2f1 mRNA expression in hif1ab MO (1α) or e2f7/8 (7/8) injected zebrafish embyros, respectively, compared to NIC. mRNA levels were determined in >30 embryos from three independent experiments. All quantified data present the average ± S.D. compared to the indicated controls in at least three independent experiments.