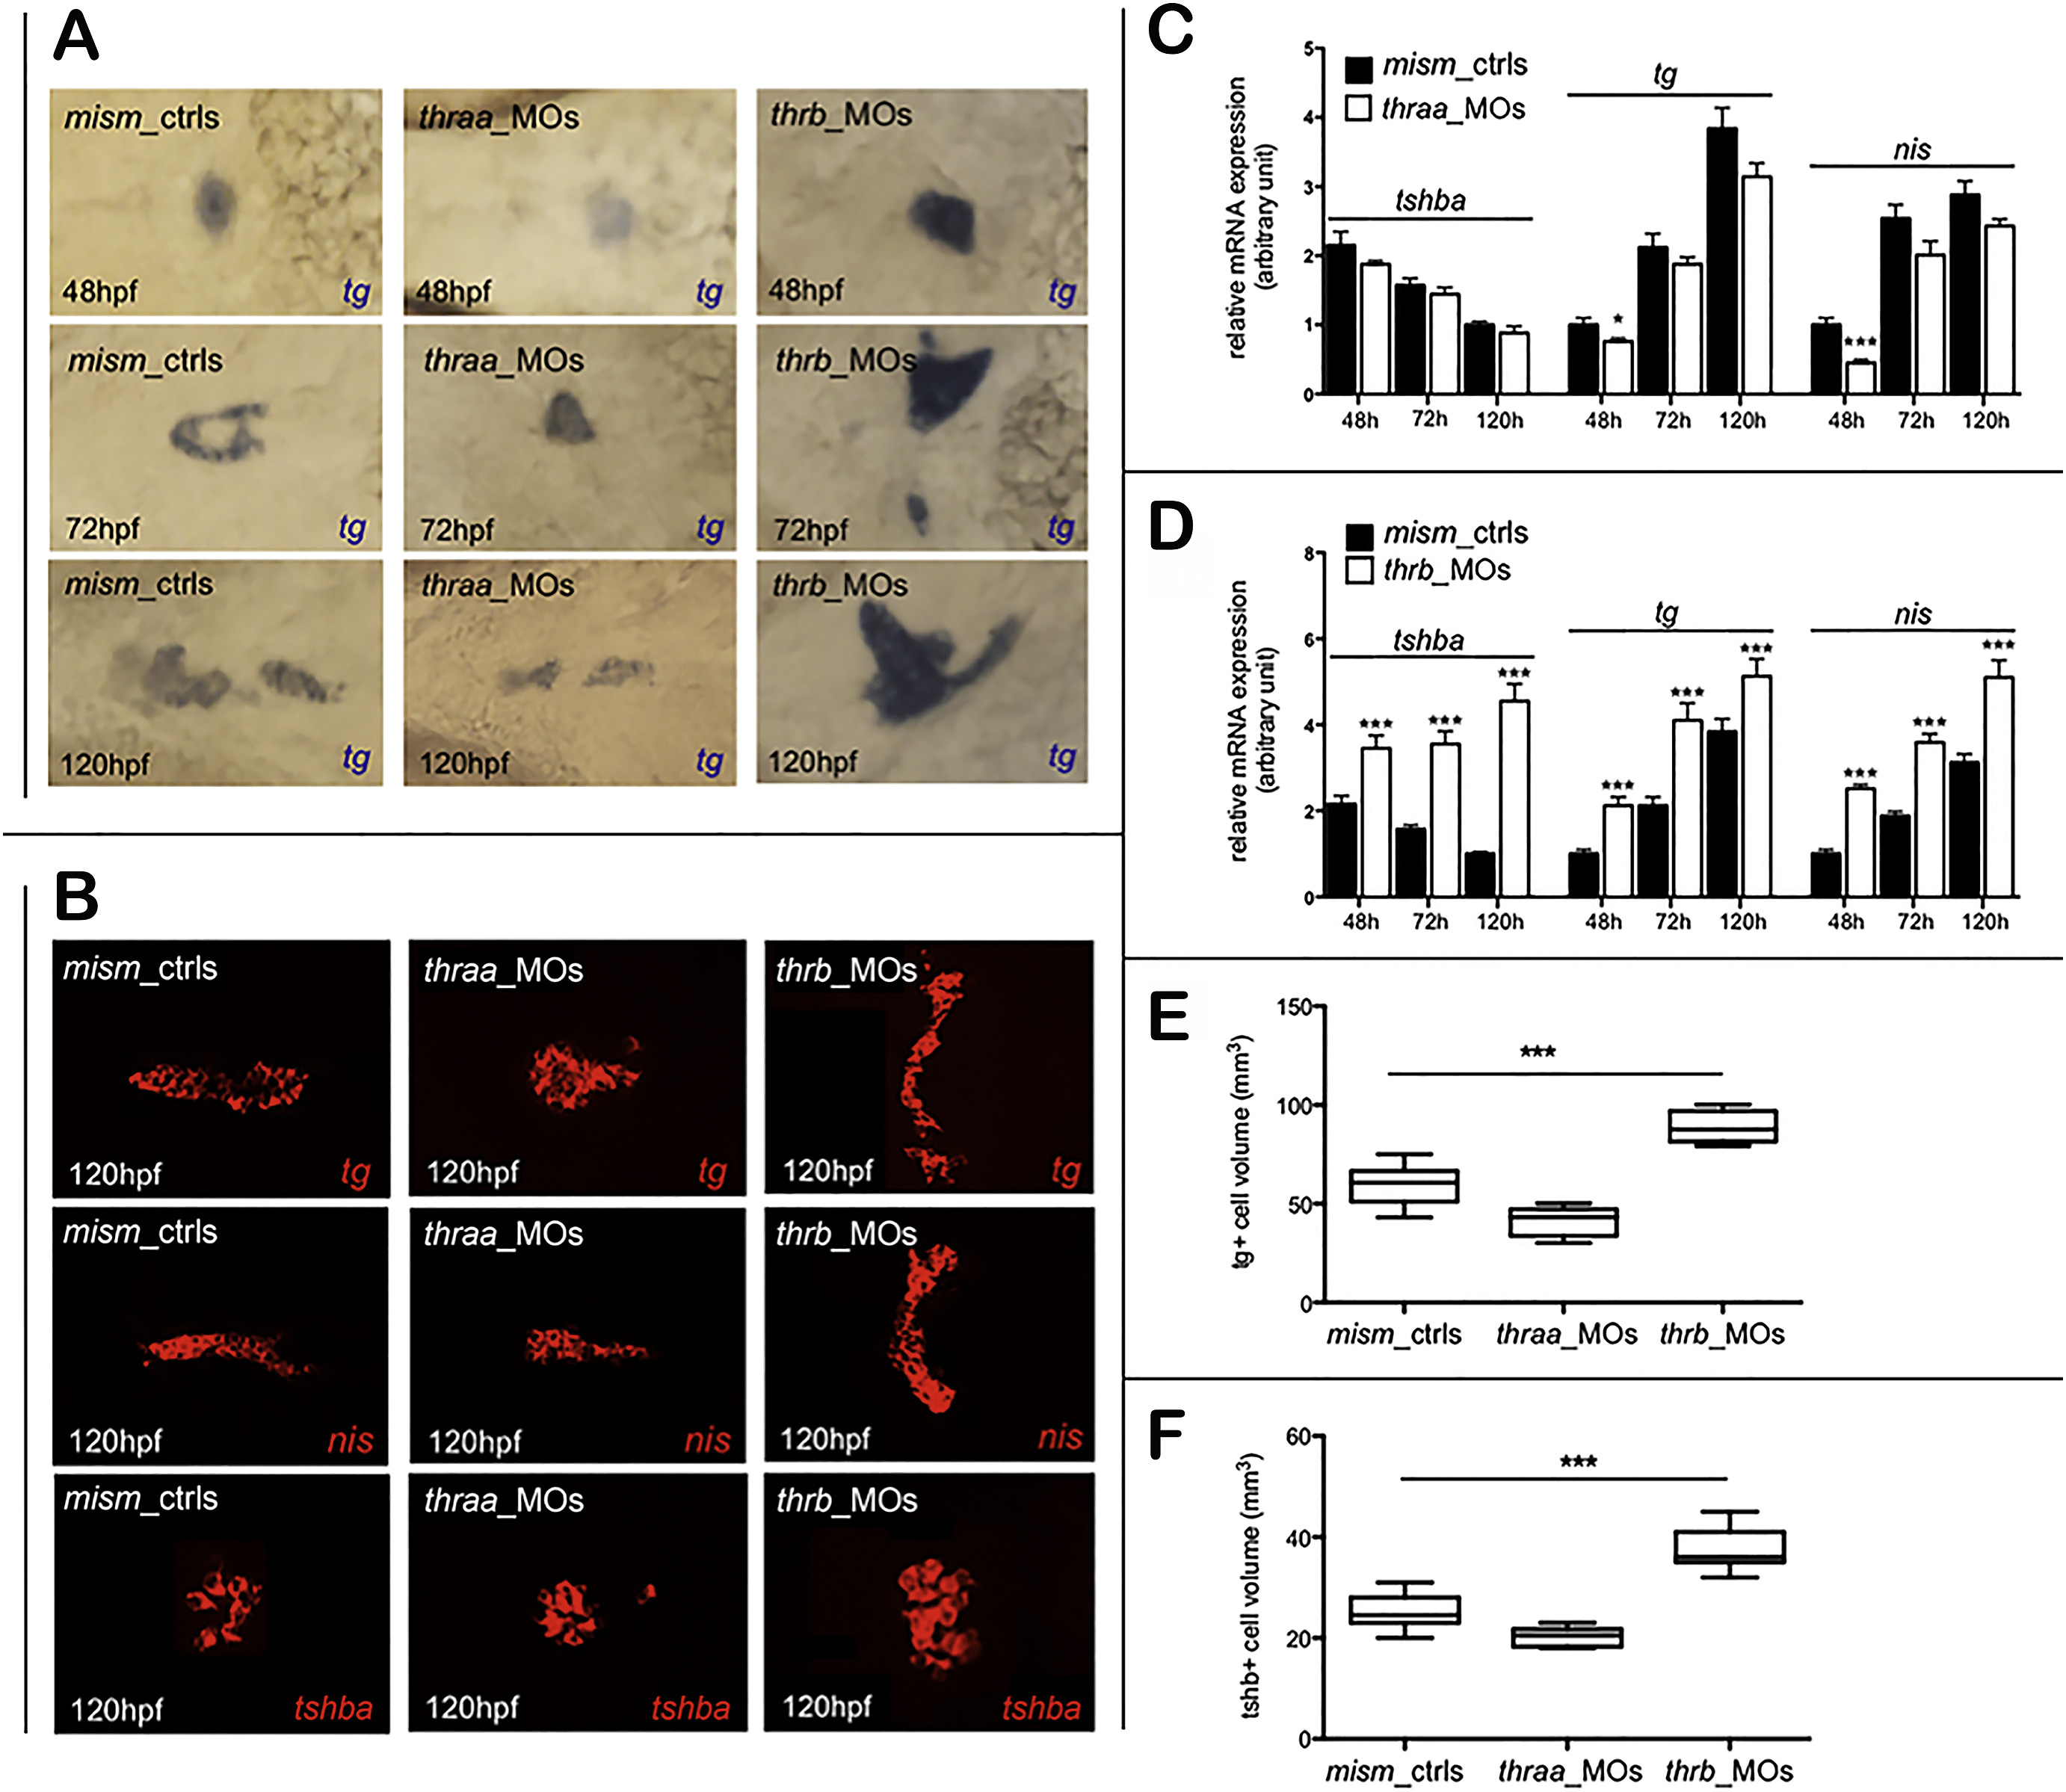
Fig. 6
Biochemical evaluation of thyroid development and function. Panel A) Thyroid development of mism_ctrls, thraa_MOs and thrb_MOs, analyzed by WISH with tg riboprobe, followed by Fast Blue staining, in embryos at 48, 72 and 120 hpf. Panel B) WISH/Fast Blue of thyroid (tg, nis) and pituitary (tshba) markers at 120 hpf followed by confocal acquisition. Bright-field and fluorescence images are representative of 3 experiments (20 embryos each, mounted in ventral view) (left-eyes, right-tail). Panels C and D) qRT-PCR of tshba, tg and nis expression at 48, 72 and 120 hpf. The total RNA was extracted from pools of 30 embryos for each time point and the relative mRNA expression was measured and normalized against the housekeeping gene eef1α. Panels E and F) Analysis of thyroid and pituitary cell-volumes (mm3) using Volocity software. *p < 0.05 and ***p < 0.001 vs mism_ctrls. (For interpretation of the references to colour in this figure legend, the reader is referred to the web version of this article.)
Reprinted from Molecular and Cellular Endocrinology, 424, Marelli, F., Carra, S., Agostini, M., Cotelli, F., Peeters, R., Chatterjee, K., Persani, L., Patterns of thyroid hormone receptor expression in zebrafish and generation of a novel model of resistance to thyroid hormone action, 102-17, Copyright (2016) with permission from Elsevier. Full text @ Mol. Cell. Endocrinol.

