
|
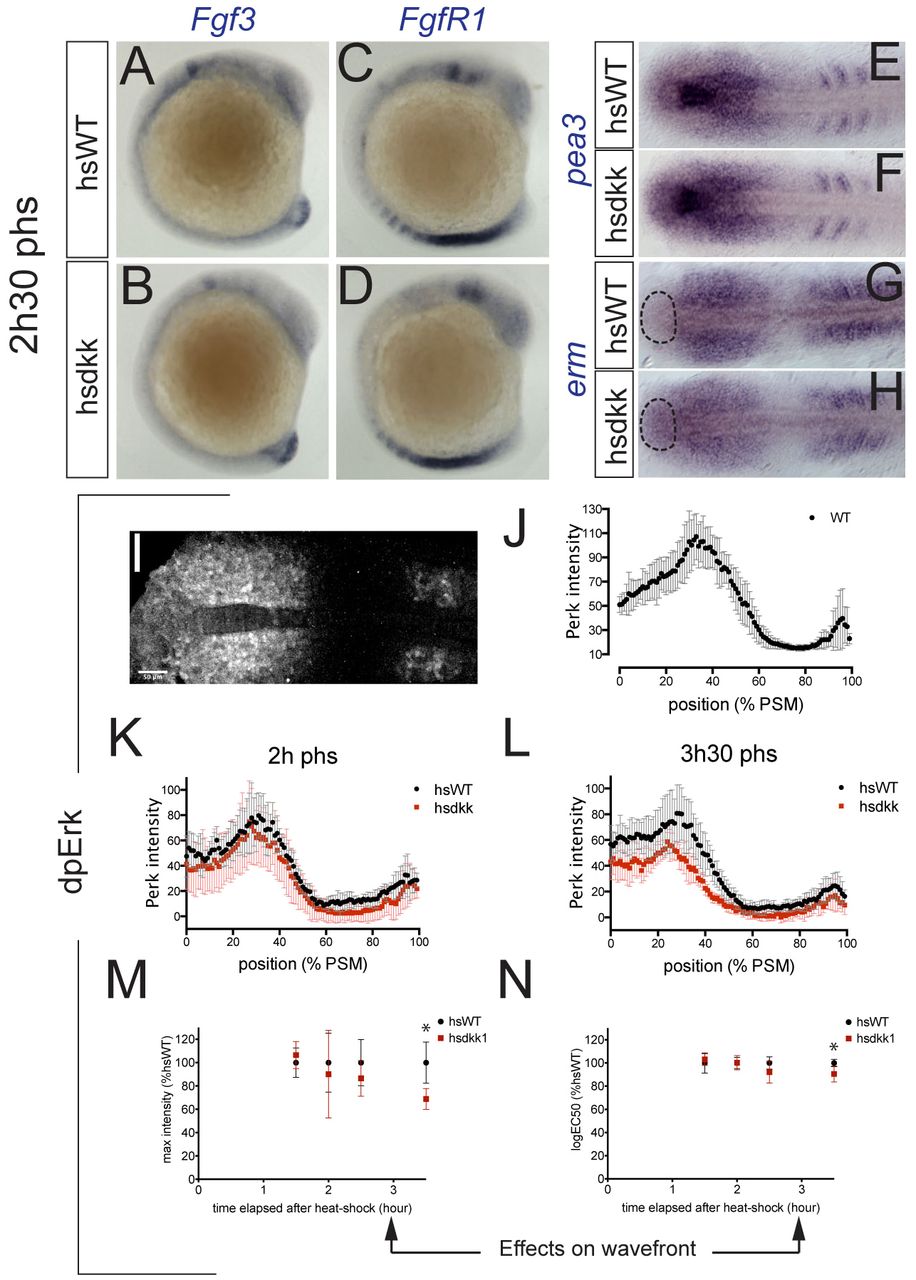
Fig. 5 Fgf activity is weakly reduced <7 somites after heat shock. (A-D) Lateral view of hsdkk1::GFP (B,D) or WT siblings (A,C) heat shocked at eight somites, fixed 2.5 hours phs and hybridized with fgf3 (A,B) or fgfr1 (C,D) riboprobes. (E-H) Dorsal view of flat-mounted PSM from hsdkk1::GFP (F,H) or WT siblings (E,G) heat shocked at eight somites, fixed 2.5 hours phs and hybridized with pea3 (E,F) or erm (G,H) riboprobes. Dashed outline indicates domain of expression elevated in hsdkk1 embryos. (I) Confocal section of flat-mounted PSM of 10-somite stage WT immunostained with dpErk antibody. (J) Average gray value intensity profile of dpErk signal in 10-somite stage WT embryos. (K,L) hsdkk1::GFP or WT siblings, heat shocked at six somites and fixed 2 (K) or 3.5 (L) hours phs, showing percentage of dpErk signal relative to hsWT dynamic range. (M,N) Time series after heat shock of maximum intensity (M) or logEC50 (N) from plots of dpErk signal normalized to hsWT. Mean ± s.d. *P<0.01.