
Fig. 1
|
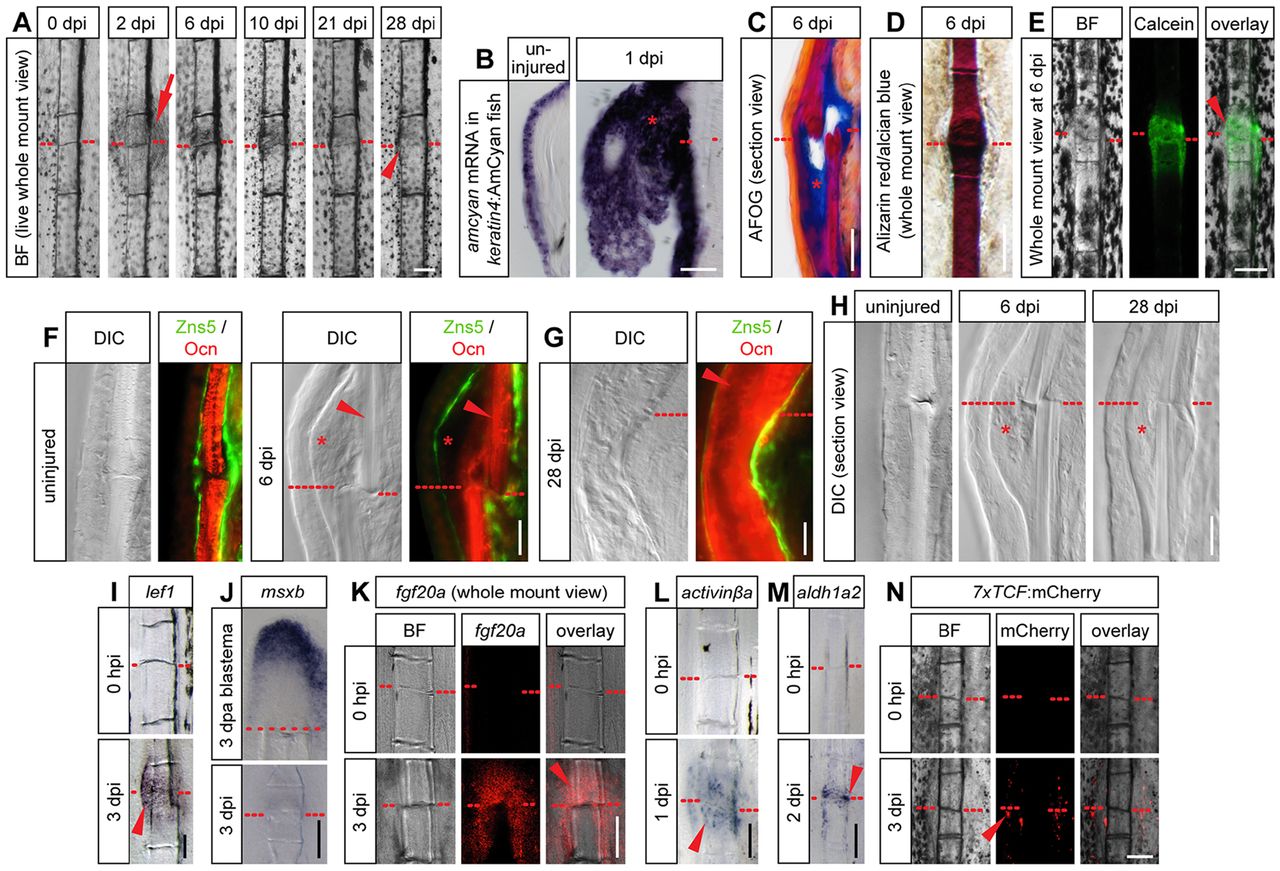
Fig. 1 Fracture model in zebrafish bony fin rays. (A) Whole-mount view of the same fractured fin ray at different time points post injury. Red dashed line, fracture; arrow, epidermal thickening; arrowhead, thickened bone. (B) Epidermal thickening at 1dpi identified by in situ hybridization against amcyan mRNA in keratin4:AmCyan transgenic fish. (C) Longitudinal section view of an AFOG-stained fin hemiray at 6dpi with collagen staining blue (asterisk). (D) Whole-mount view of an Alizarin Red/Alcian Blue stained fin ray at 6dpi. The lack of blue staining indicates intramembranous ossification. (E) Whole-mount view of a fin ray at 6dpi stained with Calcein indicates calcium incorporation into the mineralizing callus. (F,G) Immunofluorescence on longitudinal sections of individual hemirays stained for the pan-osteoblast marker Zns5 and Osteocalcin (Ocn), labeling mature bone matrix. Note the absence of Osteocalcin in the callus tissue at 6dpi (asterisk), but presence at 28dpi (arrowhead). DIC, differential interference contrast. (H) Longitudinal sections of individual fractured hemirays. Asterisk, hard callus. (I-M) Expression of the indicated genes detected by chromogenic (I,J,L,M) or fluorescent (K) whole-mount in situ hybridizations on fractured rays or amputated fins (J). (N) mCherry fluorescence is induced in fractured 7xTCF:mCherry Wnt reporter fish at 3dpi. Scale bars: 100µm in A,D,E,I-N; 50µm in B,C; 20µm in F-H. BF, brightfield.