
Fig. 7
- ID
- ZDB-IMAGE-131213-17
- Genes
- Publication
- Geng et al., 2013 - Semicircular canal morphogenesis in the zebrafish inner ear requires the function of gpr126 (lauscher), an adhesion class G protein-coupled receptor gene
- All Figures
- Figures for Geng et al., 2013
|
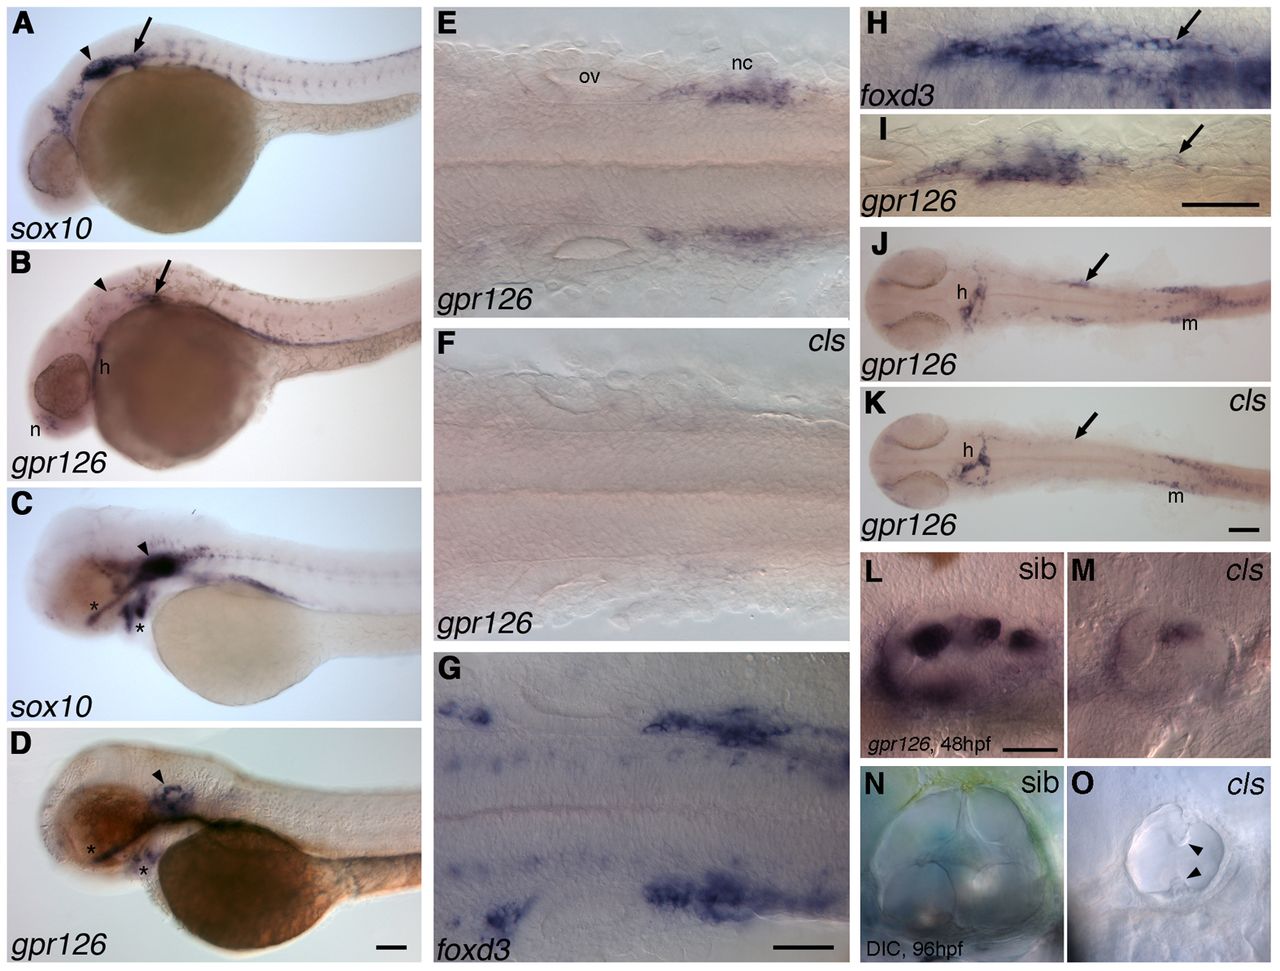
Fig. 7 Comparison of expression of gpr126 and sox10 in wild-type embryos, and expression of gpr126 in colourless (sox10-/-) mutant embryos. (A-D) Expression of gpr126 and sox10 in wild-type embryos at 24 hpf (A,B) and 48 hpf (C,D). Both genes are expressed in the otic vesicle (arrowhead), post-otic region (arrow), olfactory epithelium (nose, n) and head chondrocytes (asterisks). (E-G) Dorsal views of flat-mounted 24 hpf embryos: post-otic expression of gpr126 in the wild type (E) is lost in the cls mutant (F). Comparison with foxd3 expression identifies these cells as neural crest (G). (H,I) Dorsal view of the post-otic region showing foxd3-expressing Schwann cells extending posteriorly (H, arrow) and expression of gpr126 in the same location (I, arrow). (J,K) gpr126 expression in heart (h) and posterior mesoderm (m) persists in cls mutants, whereas neural crest expression is lost (arrows). (L,M) Expression of gpr126 is reduced in the cls mutant ear at 48 hpf, with weak expression in rudimentary projections (M). (N,O) DIC images of live ears at 96 hpf, showing a representative cls mutant ear (O). Note the small overall size and rudimentary unfused canal projections (arrowheads). Abbreviations: h, heart; m, posterior mesoderm, n, nose (olfactory epithelium); nc, neural crest; ov, otic vesicle; sib, phenotypically wild-type sibling embryo. Scale bars: in D, 100 μm for A-D; in G, 50 μm for to E-G; in I, 50 μm for H,I; in K, 100 μm for J,K; in L, 50 μm for L-O.