
IMAGE
Fig. 6
- ID
- ZDB-IMAGE-130429-38
- Genes
- Publication
- Wolf et al., 2013 - Specification of posterior hypothalamic neurons requires coordinated activities of Fezf2, Otp, Sim1a and Foxb1.2
- All Figures
- Figures for Wolf et al., 2013
Image
|
Figure Caption
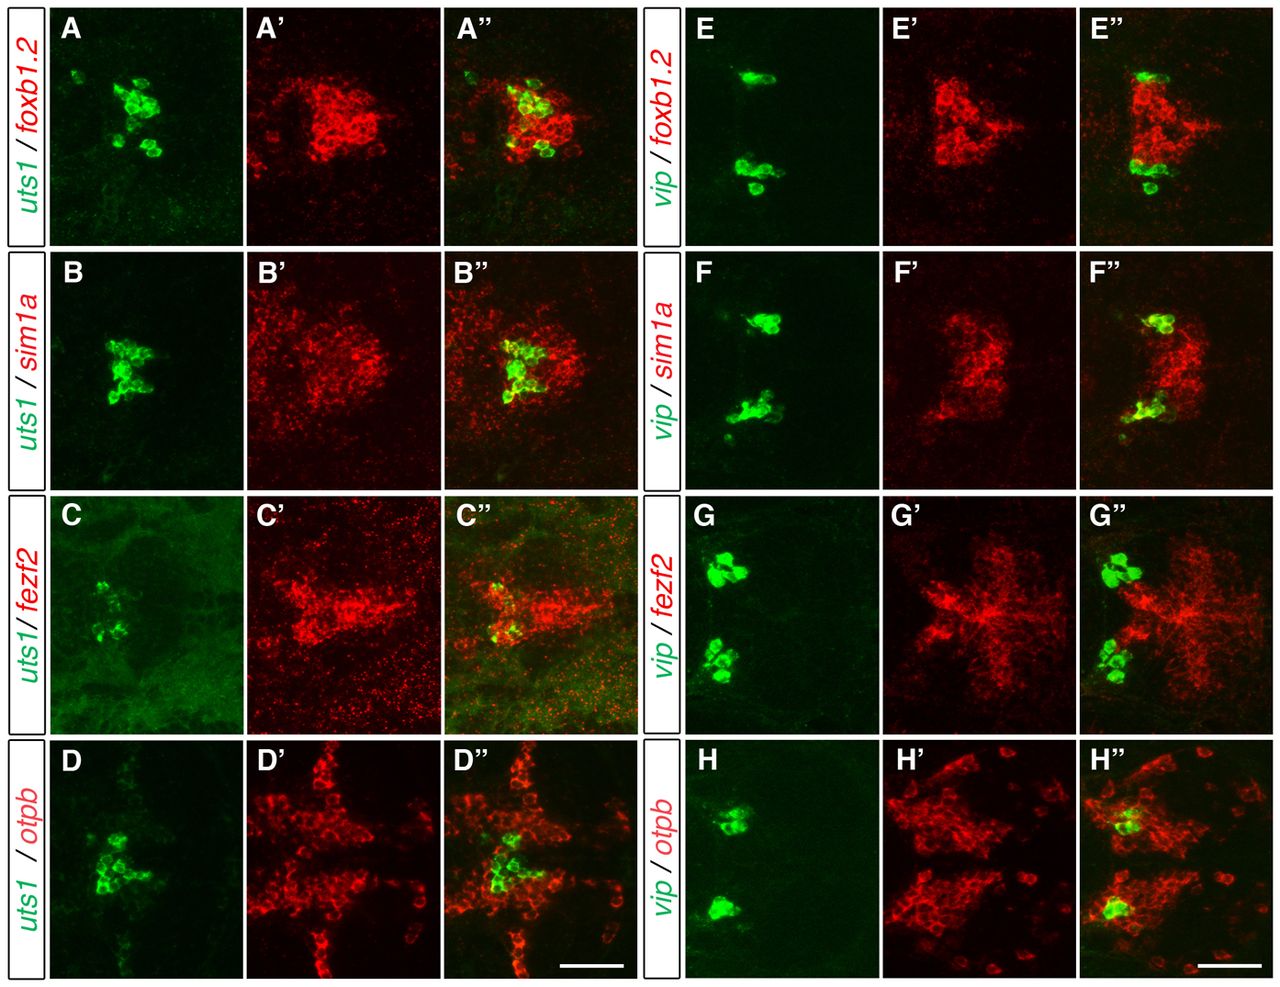
Fig. 6 Vip- and Uts1-positive neurons develop within different MA domains. (A-H′′) Two-color FISH of 3-dpf (A-D′′) and 2-dpf (E-H′′) wild-type zebrafish embryos to detect the relative expression of vip, uts1, otpb, sim1a, fezf2 and foxb1.2 in the MA. uts1 is co-expressed with foxb1.2 (A-A′′), sim1a (B-B′′) and fezf2 (C-C′′) but not with otpb (D-D′′). By contrast, vip is not co-expressed with foxb1.2 (E-E′′) and fezf2 (G-G′′), whereas it is co-expressed with sim1a (F-F′′) and otpb (H-H′′). Maximum projections of 10-15 μm confocal stacks in the dorsal view are shown. Scale bar: 60 μm.
Figure Data
Acknowledgments
This image is the copyrighted work of the attributed author or publisher, and
ZFIN has permission only to display this image to its users.
Additional permissions should be obtained from the applicable author or publisher of the image.
Full text @ Development