
Fig. 7
- ID
- ZDB-IMAGE-111101-30
- Genes
- Publication
- Swartz et al., 2011 - Examination of a palatogenic gene program in zebrafish
- All Figures
- Figures for Swartz et al., 2011
|
Fig. 7
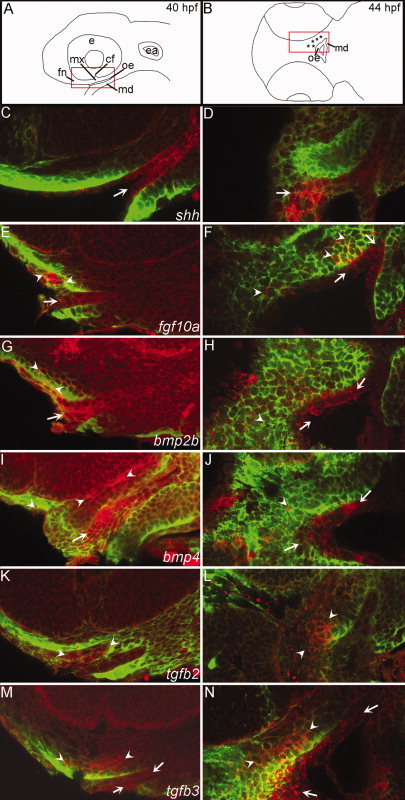
Fluorescent in situ hybridization optical sections verify the expression patterns of signaling molecules at 40 and 44 hours postfertilization (hpf). A: Schematic lateral view of the zebrafish head at 40 hpf, red box indicates the magnified view of the in situ sagittal optical sections. B: Schematic diagram of the zebrafish head in ventral view, red box indicates area of in situ horizontal optical sections. C–N: mRNA localization is detected by fluorescence of NBT/BCIP precipitate in red and anti-enhanced green fluorescent protein (EGFP) immunostaining labels cranial neural crest cells (CNCC) in the fli1:EGFP transgenic background in green. Arrowheads indicate areas of CNCC expression domains, arrows indicate expression in the oral ectoderm. C,D:shh is expressed in the oral ectoderm at both time points. E: Both anterior oral ectoderm and frontonasal and maxillary CNCC express fgf10a at 40 hpf. F:fgf10a CNCC expression and oral ectodermal expression remains at 44 hpf. G: Anterior CNCCs and oral ectoderm express bmp2b at 40 hpf. H: By 44 hpf bmp2b is expressed more broadly in the oral ectoderm and less in the CNCC. I:bmp4 expression is in the oral ectoderm and the CNCC. J: At 44 hpf only a few CNCC express bmp4 while much of the oral ectoderm maintains bmp4 expression. K,L: Anterior CNCC express tgfb2 at 40 and 44 hpf. M–N: At both 40 and 44 hpf tgfb3 is expressed in anterior CNCC and the weak expression in the oral ectoderm.