
|
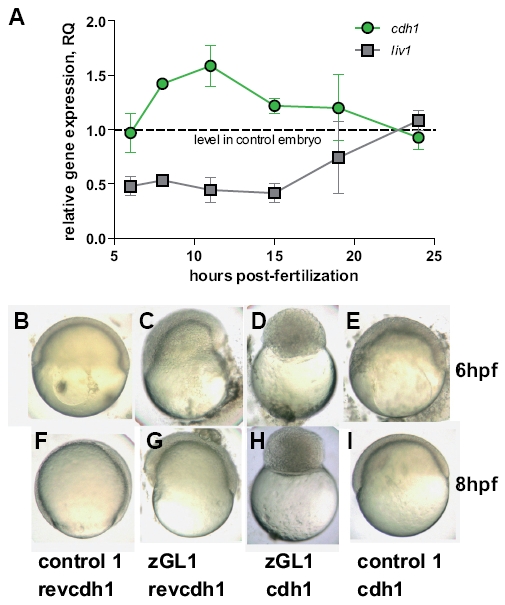
Fig. 7 Gitrl and the Stat3-Liv1-Cdh1 axis. (A) Transcription of liv1 and cdh1 were assessed by real-time PCR at various time points during gastrulation and segmentation in embryos injected with 10 ng of either control1 or zGL1. Values were normalised to ef1α and levels in zGL1 injected embryos expressed relative to levels detected in control-injected embryos using the ΔΔCt method (ABI Prism 7700 Sequence Detection System, user bulletin no. 2). Mean values ± SD of three independent experiments are shown. Embryos injected with either (B,F) 10 ng of control 1 + 2.5 ng of cdh1 MO control (revcdh1), (C,G) 10 ng of zGL1 + 2.5 ng revcdh1, (D,H) 10 ng of zGL1 + 2.5 ng of cdh1 MO (cdh1) or (E,I) 10 ng of control 1 + 2.5 ng of cdh1 were observed at (B-E) 6 and (F-I) 8 hpf. Embryos treated with control MOs only were indistinguishable from wild-type embryos. Those treated with the zGL1 plus revcdh1 showed the characteristics of gitrl morphants previously described, and embryos injected with cdh1 MO plus control1 resembled the avalanche mutant (Kane et al., 1996). Surprisingly, embryos co-injected with both gitrl and cdh1 MOs had a novel phenotype characterized by arrest during the blastula period and a complete failure to enter epiboly. The phenotype shown in (D) and (H) persisted until the embryos died at approximately 15 hpf.