
|
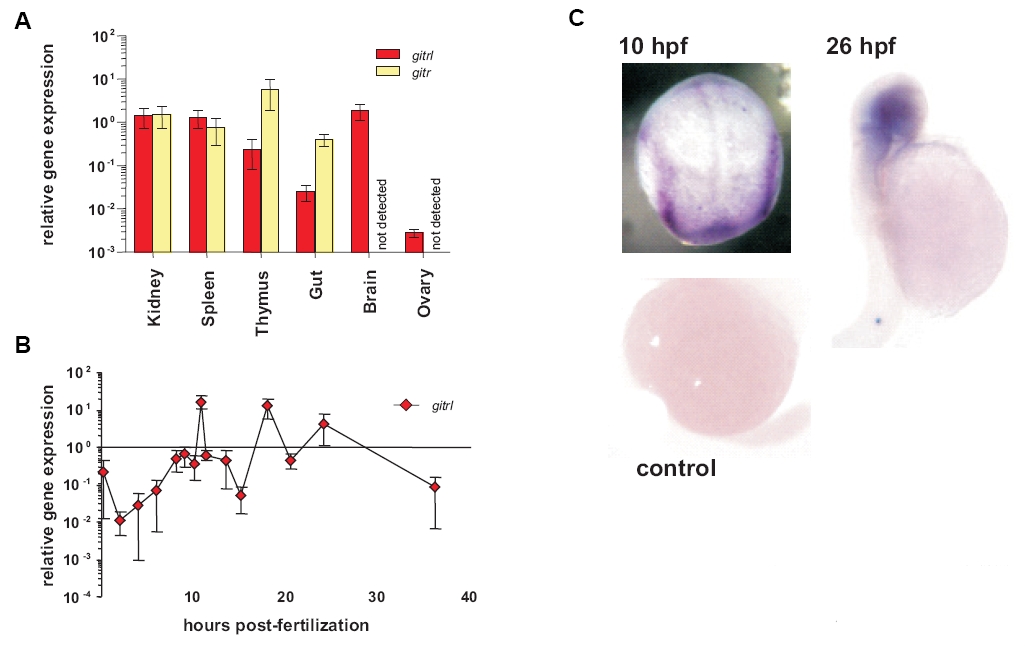
Fig. 2 Expression of zebrafish gitrl and girt genes in adult tissues and during development. Real-time PCR was used to assess the expression of gitrl and girt in (A) adult zebrafish tissues and (B) at different time points during embryonic development. Gene expression was quantified using a standard curve method and is shown normalised to ef1α transcript levels and expressed relative to levels in adult kidney. Values are shown as mean ± SD of technical triplicates for an individual experiment representative of three biological replicates. In adult tissues girt mRNA was not detected in brain or ovary. In embryos, only gitrl is shown as no girt mRNA was detected during this period. (C) Localisation of gitrl transcripts at different time-points within developing embryos was investigated by in situ hybridization using a DIG-labelled antisense RNA probe. Distinct bands along the paraxial mesoderm can be seen at 10 hpf, with localization of expression to the head region by 26 hpf. A control embryo processed at 16 hpf in the absence of probe is shown to indicate the level of background staining and any yolk trapping.