
Fig. 1
- ID
- ZDB-IMAGE-091113-14
- Genes
- Publication
- Elsen et al., 2009 - The autism susceptibility gene met regulates zebrafish cerebellar development and facial motor neuron migration
- All Figures
- Figures for Elsen et al., 2009
|
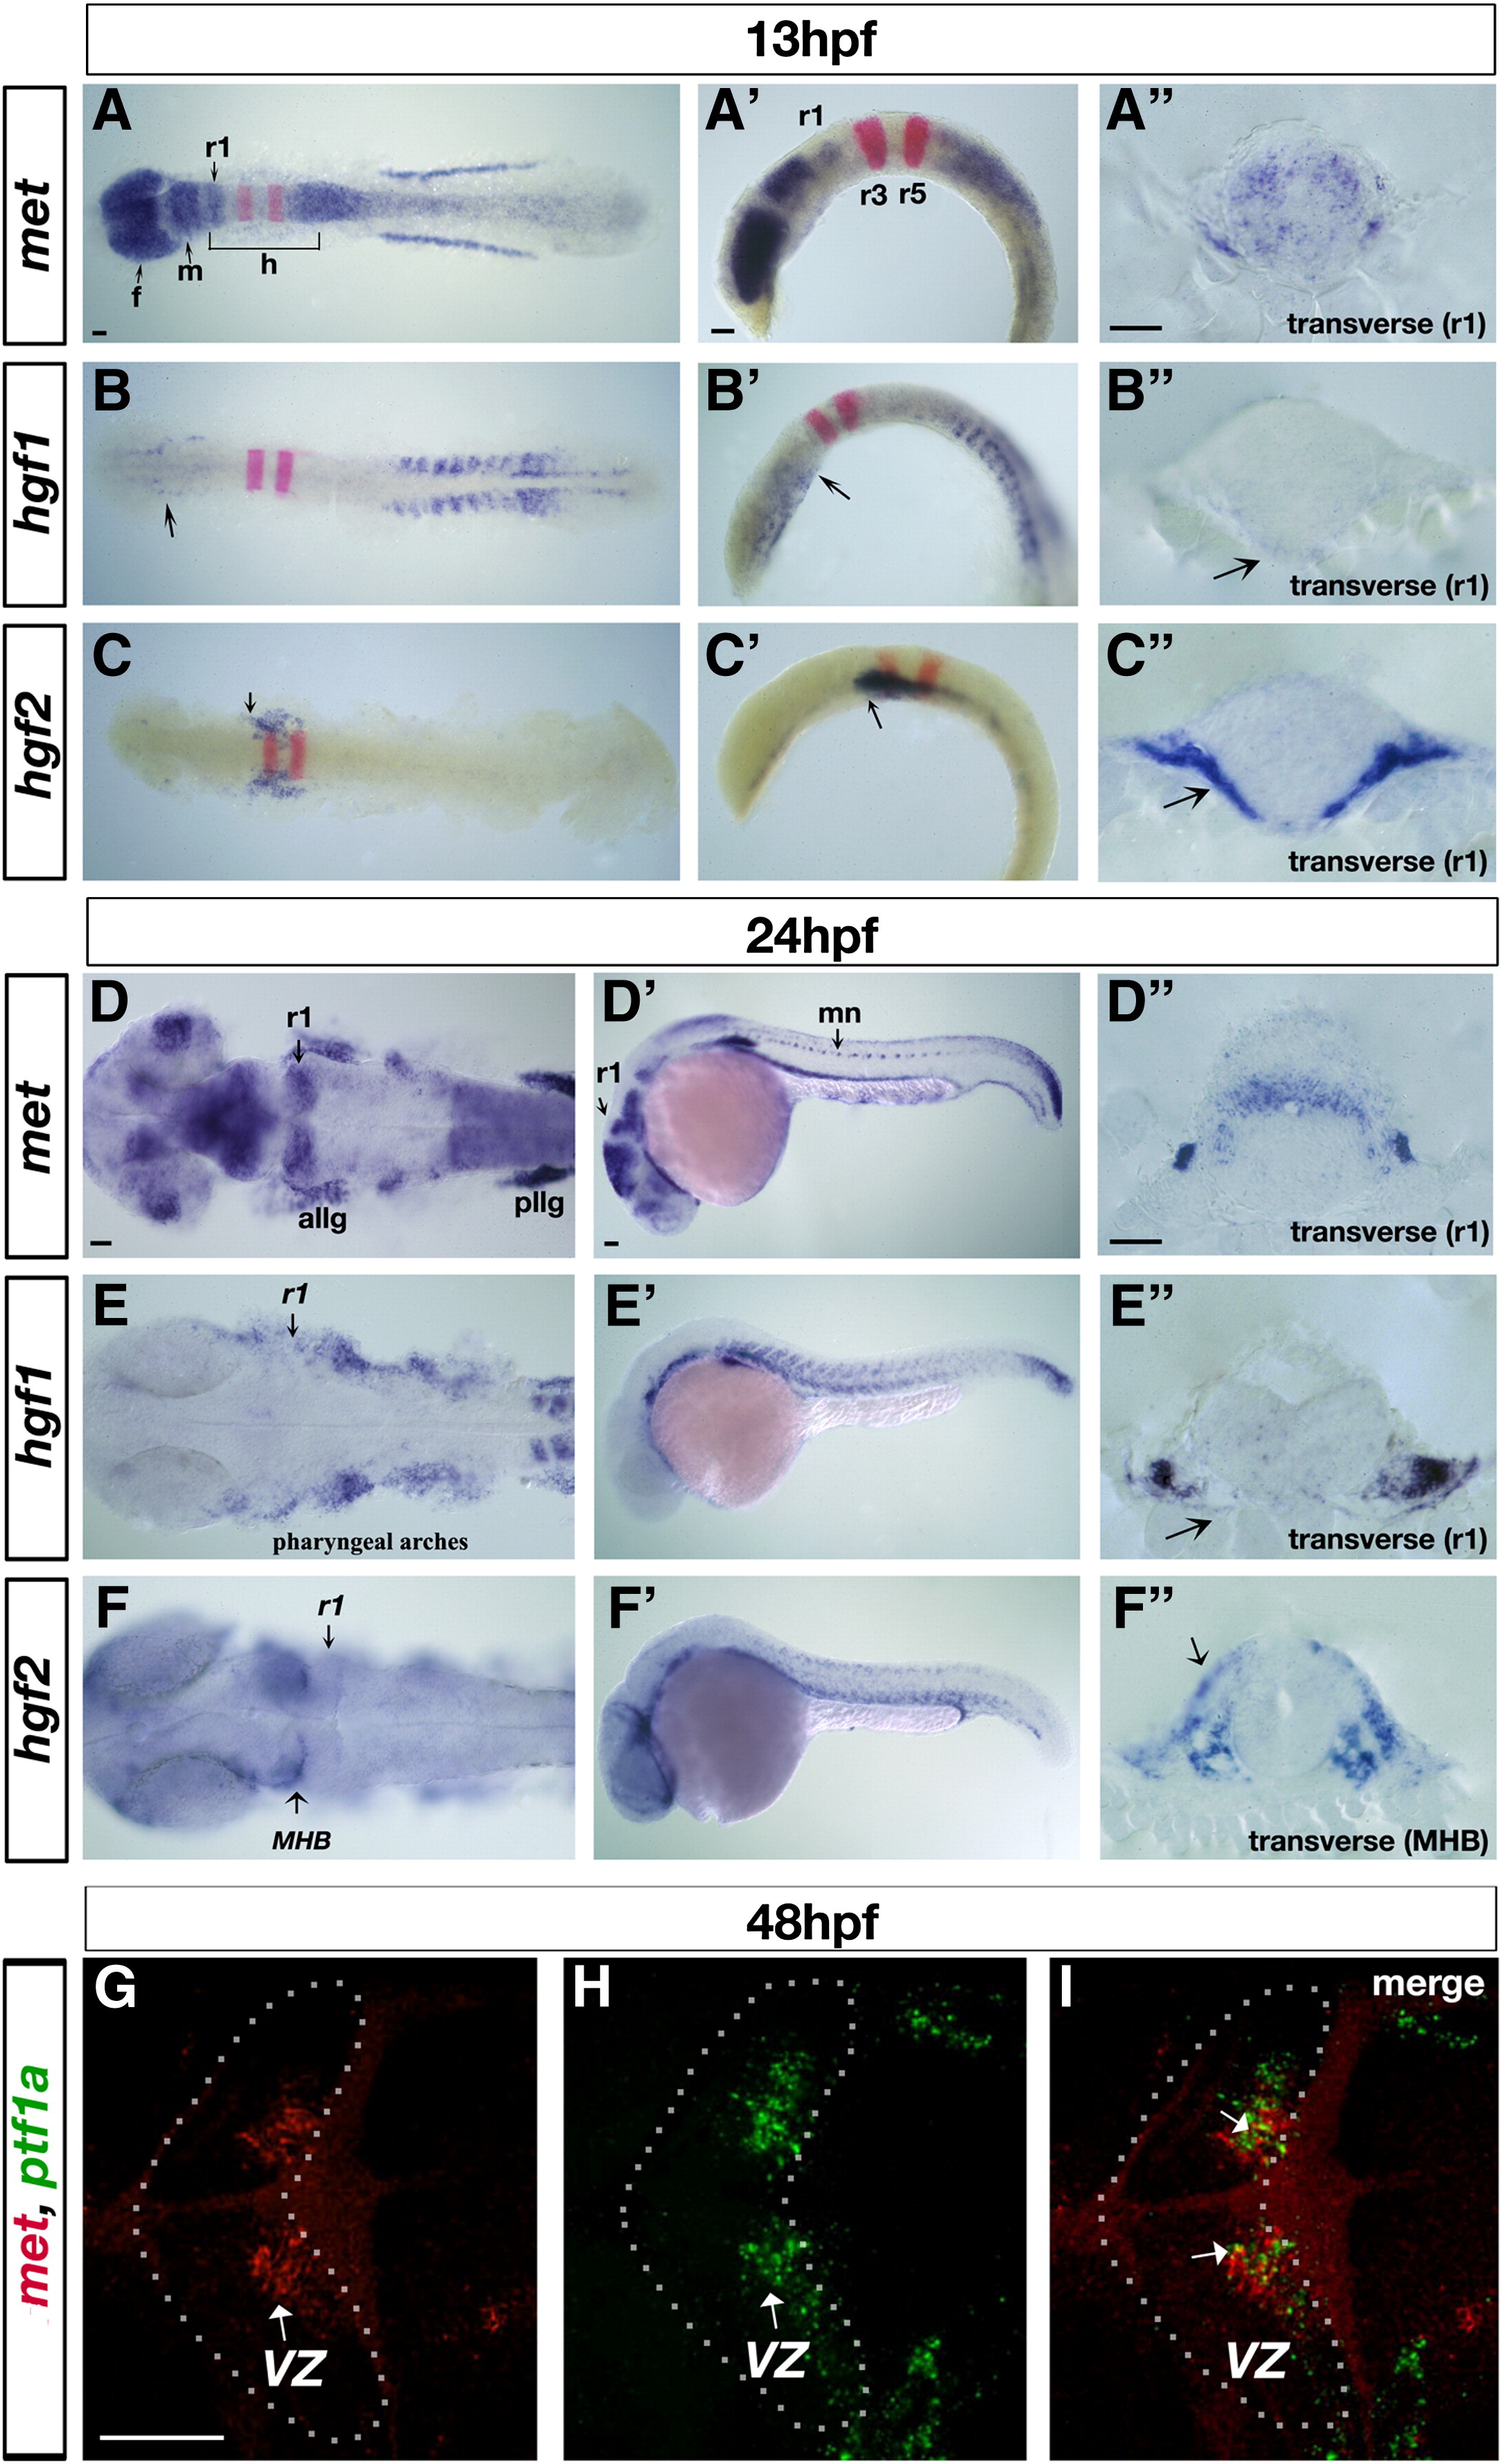
Fig. 1 Zebrafish met receptor and hgf1 and hgf2 ligand expression patterns in the nervous system. (A–F) in situ hybridization revealing expression of met receptor (A–A″ and D–D″), hgf1 ligand (B–B″ and E–E″) and hgf2 ligand (C–C″ and F–F″) at 13 hpf (A–C″) and 24 hpf (D–F″) in dorsal (A–F), lateral (A′–F′) and transverse views (A″–F″). krox20 expression (red in A–C′) marks rhombomere (r) 3 and r5. At 13 hpf, met (A–A″) is expressed at high levels in the forebrain, dorsal midbrain, a stripe in r1 and in a gradient starting in r7 that tapers off towards the posterior part of the spinal cord. met is also present at low levels throughout the hindbrain. At 24 hpf, met (D–D″) continues to be expressed in the forebrain regions, eyes, dorsal midbrain, dorsal r1 and in a gradient from r7 towards the posterior, as well as in the anterior and posterior lateral line ganglia, and motor neurons of the spinal cord. At 13 hpf, hgf1 (B–B″) is expressed in the ventral regions of the forebrain (arrow in B), and at low levels throughout the hindbrain, in ventral regions surrounding r1 (arrow in B′ and B″), while hgf2 (C–C″) is expressed in low levels in the hindbrain and in ventral regions surrounding the hindbrain (arrow in C, C′ and C″), including r1. At 24 hpf, hgf1 (E–E″) is expressed at low levels throughout the hindbrain, in ventral tissues surrounding r1 and in pharyngeal arches, while hgf2 (F–F″) is expressed in the dorsal eye, ventral tissues surrounding the hindbrain and in tissues surrounding the MHB (arrow in F and F″). (G–I) Confocal images of double fluorescent in situ hybridization with met (G) and ptf1a (H) in dorsal view, anterior to the left, at 48 hpf, showing colocalization of the two transcripts in a small number of cells (arrows in I, merged) in the VZ (arrows in G and H) of the cerebellum (outlined in G–I). r5, rhombomere5; r1, rhombomere1; r7, rhombomere7; allg, anterior lateral line ganglia; pllg, posterior lateral line ganglia; mn, motor neurons; MHB, midbrain–hindbrain boundary; VZ, ventricular zone. Scale bar, 50 μm.
Reprinted from Developmental Biology, 335(1), Elsen, G.E., Choi, L.Y., Prince, V.E., and Ho, R.K., The autism susceptibility gene met regulates zebrafish cerebellar development and facial motor neuron migration, 78-92, Copyright (2009) with permission from Elsevier. Full text @ Dev. Biol.