
IMAGE
Fig. S2
- ID
- ZDB-IMAGE-090804-93
- Genes
- Publication
- Nikolaou et al., 2009 - Lunatic fringe promotes the lateral inhibition of neurogenesis
- All Figures
- Figures for Nikolaou et al., 2009
Image
|
Figure Caption
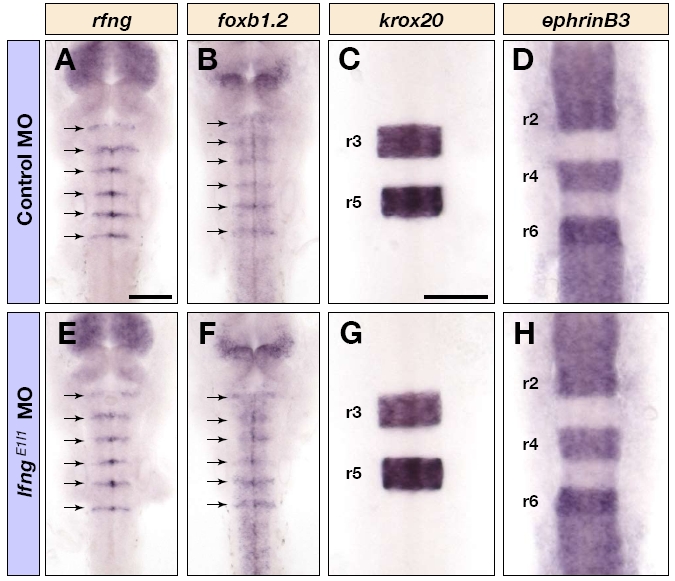
Fig. S2 Knockdown of lfng does not affect hindbrain boundary formation or segmentation. Dorsal views of control MO (A-D) and lfngE1I1 MO (E-H) injected embryos at 16 hpf (C,D,G,H) and 24 hpf (A,B,E,F), showing rfng (A,E), foxb1.2 (B,F), krox20 (C,G) and ephrin B3 (D,H) mRNA expression in the hindbrain. The arrows in A, B, E and F indicate boundary expression. Scale bars: 100 μm in A for A,B,E,F; 100 μm in C for C,D,G,H.
Figure Data
Acknowledgments
This image is the copyrighted work of the attributed author or publisher, and
ZFIN has permission only to display this image to its users.
Additional permissions should be obtained from the applicable author or publisher of the image.
Full text @ Development