
Fig. 4
- ID
- ZDB-IMAGE-090224-30
- Genes
- Publication
- Gribble et al., 2009 - Tcf3 inhibits spinal cord neurogenesis by regulating sox4a expression
- All Figures
- Figures for Gribble et al., 2009
|
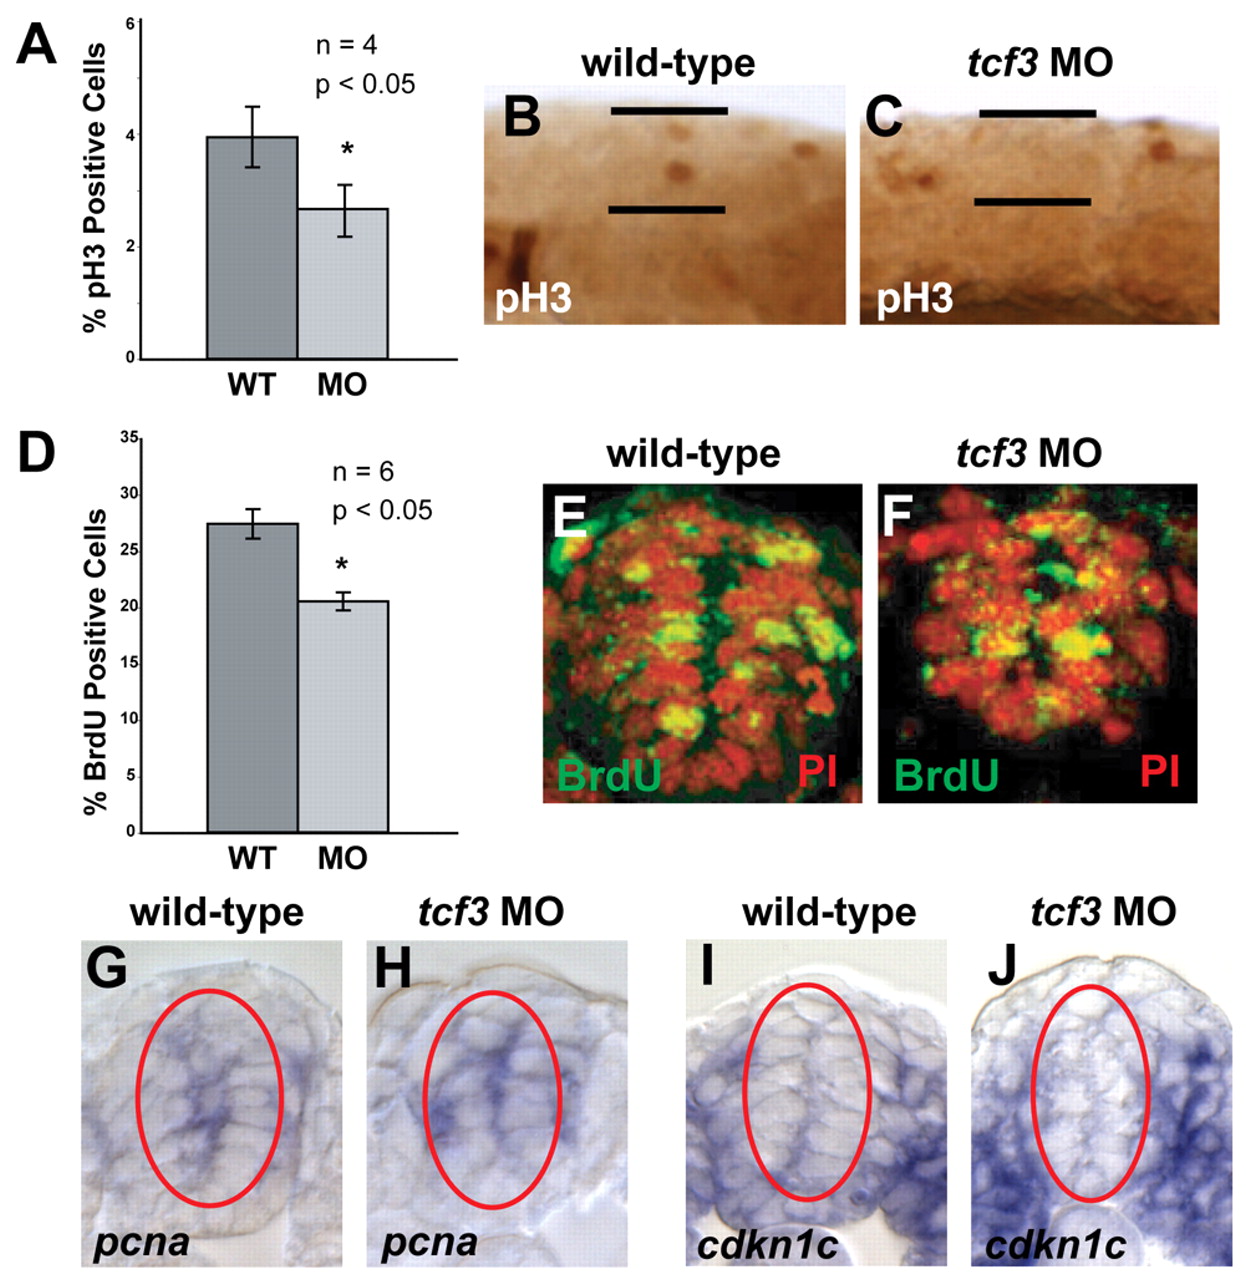
Fig. 4 Tcf3 controls the rate of spinal progenitor proliferation. (A-F) The mitotic index (A-C) and the BrdU-labeling index (D-F) of tcf3 morphant (MO) embryos are slightly decreased, yet significantly different (*), as compared with wild-type (WT) embryos. Error bars show s.e.m. and P-values were calculated using unpaired t-tests. (B,C) Whole-mount views of anti-pH3 staining, with the spinal cord demarcated by the black lines. (E,F) Cross-sections, with BrdU staining in green and propidium iodide (PI) counterstaining in red. (G-J) In situ hybridization on cross-sections shows that proliferative cell nuclear antigen (pcna) and cdkn1c (p57) are expressed normally in tcf3 morphants at 18 hpf.