
IMAGE
Fig. 1
- ID
- ZDB-IMAGE-090224-27
- Genes
- Publication
- Gribble et al., 2009 - Tcf3 inhibits spinal cord neurogenesis by regulating sox4a expression
- All Figures
- Figures for Gribble et al., 2009
Image
|
Figure Caption
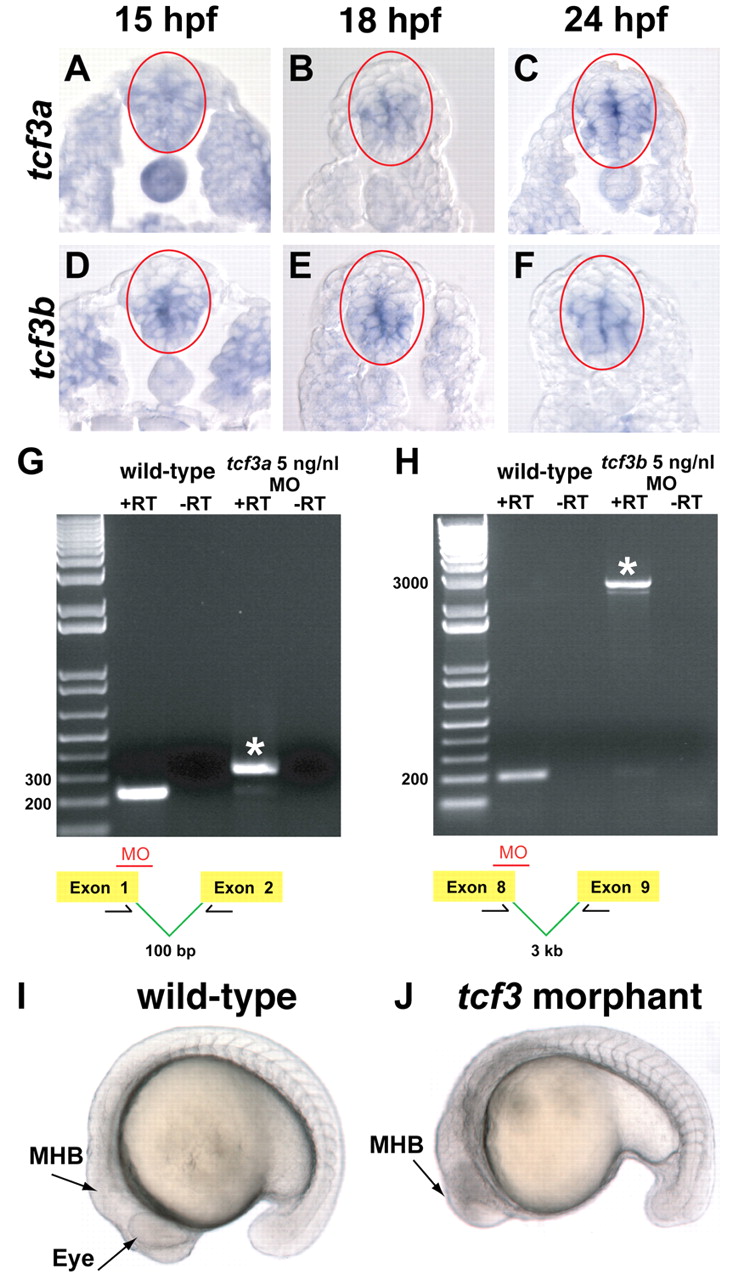
Fig. 1 Analysis of tcf3a and tcf3b spinal cord expression and effectiveness of morpholinos. (A-F) Cross-sections with the spinal cord outlined in red. tcf3a and tcf3b are co-expressed in the intermediate and ventral spinal cord at 15 hpf (A,D), 18 hpf (B,E) and 24 hpf (C,F). (G,H) RT-PCRs for both tcf3a and tcf3b splice morphants show unspliced products (the asterisk in each gel) at 5 ng/nl for each morpholino. (I,J) tcf3 splice morphant embryos lack eyes, produce minimal brain tissue rostral to the midbrain-hindbrain boundary (MHB) and have a shortened rostral-caudal axis.
Figure Data
Acknowledgments
This image is the copyrighted work of the attributed author or publisher, and
ZFIN has permission only to display this image to its users.
Additional permissions should be obtained from the applicable author or publisher of the image.
Full text @ Development