
|
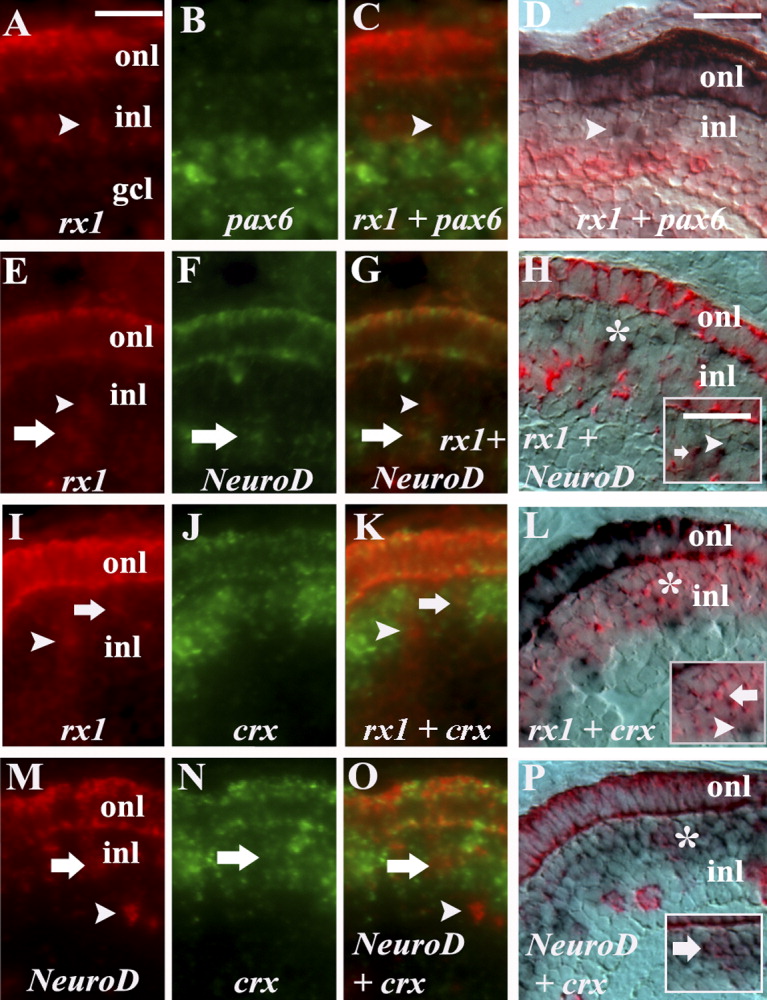
Fig. 7 Rx1 coexpression with rod lineage markers. A-C: rx1 (A) and pax6 (B) double in situ; merged image (C) showing no colabeled cells (arrowhead). D: rx1 (purple) and pax6 (pink) using alternative reaction products; arrowhead = rx1+ cell only. E-G: rx1 (E) and NeuroD (F); merged image (G) showing colabeling in the inl (arrow) and throughout the onl; arrowhead = rx1+ cell only. H: rx1 (purple) and NeuroD (pink) using alternative reaction products; doubly-labeled cell (arrow) and rx1+ cell only (arrowhead). I-K: rx1 (I) and crx (J); merged image (K) showing a colabeled cell in the inl (arrow) and throughout the onl; arrowhead = rx1+ cell only. L: rx1 (purple) and crx (pink) using alternative reaction products, showing a doubly-labeled cell (arrow) and an rx1+ cell only (arrowhead). M-O: NeuroD (M) and crx (N); merged image (O) showing a colabeled cell in the inl (arrow) and throughout the onl; arrowhead = NeuroD+ cell only. P: NeuroD (pink) and crx (purple) using alternative reaction products, showing doubly-labeled cell (arrow). onl, outer nuclear layer; inl, inner nuclear layer; scale bar in A (applies to A-C,E-G,I-K,M-O) = 20 μm; in D (applies to E,H,L,P) = 20 μm. *, areas enlarged in insets.