
Fig. 5
- ID
- ZDB-IMAGE-081007-18
- Genes
- Publication
- Mudumana et al., 2008 - odd skipped related1 reveals a novel role for endoderm in regulating kidney versus vascular cell fate
- All Figures
- Figures for Mudumana et al., 2008
|
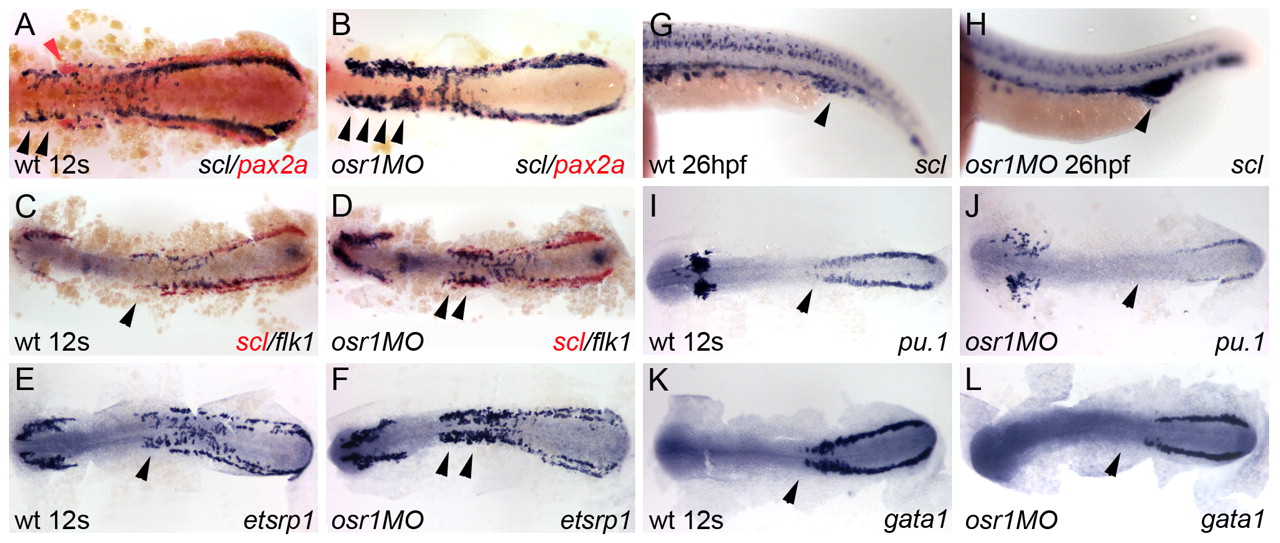
Fig. 5 osr1 knockdown expands vascular progenitor tissue. (A) scl (blue) and pax2a (red) expression in wild-type embryos labels adjacent bands (arrowheads) of intermediate mesoderm in 12-somite stage wild-type embryos. (B) osr1 knockdown results in expansion of scl-positive tissue, most prominently in anterior LPM (arrowheads) and loss of pax2a-expressing cells. (C) flk1 (blue) and scl (red) expression in 12-somite wild-type embryos (arrowhead). (D) osr1 knockdown increases the number of flk1-expressing cells (arrowheads). (E) etsrp1 expression in control 12-somite embryos (arrowhead). (F) etsrp1 expression is expanded in 12-somite stage osr1 morphants (arrowheads). (G) At 26 hpf, scl is expressed in the blood islands and forming venous plexus (arrowhead). (H) 26 hpf osr1 morphants show an expansion of scl-positive tissue in the region of the forming venous plexus (arrowhead). (I,J) Expression of the monocyte lineage marker pu.1 in wild-type embryos (I) and osr1 morphants (J) shows a reduction of expression in the anterior aspect of its LPM expression domain (arrowheads). (K,L) Similarly, expression of the erythrocyte marker gata1 in wild-type embryos (K) and osr1 morphants (L) shows a reduction of expression in its most anterior expression domain (arrowheads).