
Fig. 2
- ID
- ZDB-IMAGE-080411-43
- Genes
- Publication
- Eaton et al., 2008 - Ontogeny of vasotocin-expressing cells in zebrafish: Selective requirement for the transcriptional regulators orthopedia and single-minded 1 in the preoptic area
- All Figures
- Figures for Eaton et al., 2008
|
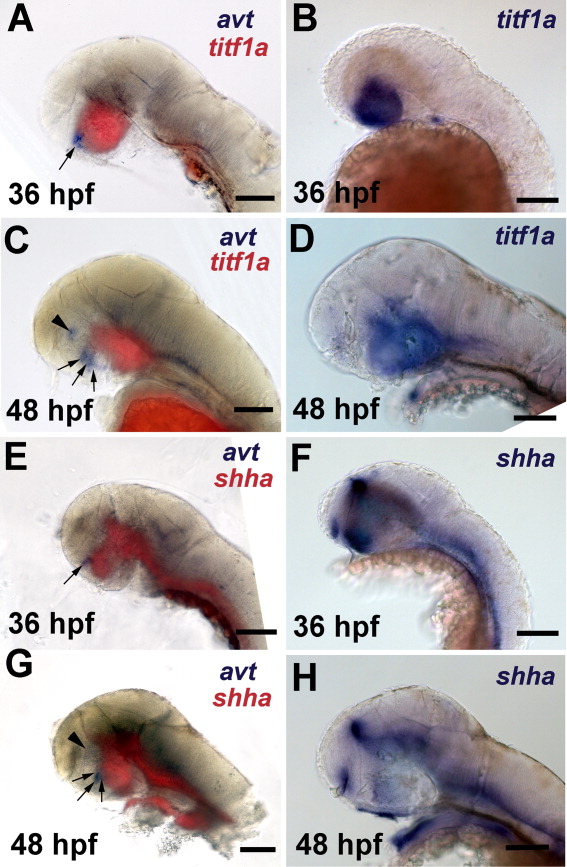
Fig. 2 A-E: The avt-expressing cells of the ventral hypothalamus are located at the edges of the shha and titf1a expression domains. Coexpression of avt, titf1a, and shha mRNA was determined by double-label in situ hybridization (ISH). Lateral views, dorsal is up and anterior to the left. The age of the embryos is indicated on each panel in hours postfertilization (hpf). A,C,D,E,G,H: The eyes have been removed. The identity and color of the probes are indicated on each panel. A,C,E,G: Images are merged composites of brightfield and epifluorescence images. The avt-expressing cell groups in the ventral hypothalamus are indicated by black arrows, whereas the avt cell group in the dorsal preoptic area is indicated with a black arrowhead. Scale bars = 100 μm.