
Fig. 6
- ID
- ZDB-IMAGE-071004-124
- Genes
- Publication
- Dooley et al., 2005 - Zebrafish scl functions independently in hematopoietic and endothelial development
- All Figures
- Figures for Dooley et al., 2005
|
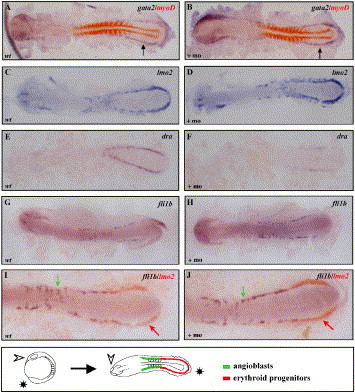
Fig. 6 Analysis of early gene expression in the scl morphants. Expression of gata2 (A, B), lmo2 (C, D), dra (E, F) and fli1b (I, J) at the 10- to 12-somite stage in scl morphants and uninjected controls. As an internal control, the gata2 ISH was performed as a double with myoD, a marker of the somitic tissue, detected in red (A, B). (I, J) Double ISH using probes for lmo2 (red arrow) and fli1b (green arrow) in uninjected and scl morphant embryo, showing higher magnification of posterior mesoderm. All embryos were flat mounted and shown with anterior to the left. In D, a schematic illustrates the orientation of embryos and regions of erythroid progenitors and angioblasts.
Reprinted from Developmental Biology, 277(2), Dooley, K.A., Davidson, A.J., and Zon, L.I., Zebrafish scl functions independently in hematopoietic and endothelial development, 522-536, Copyright (2005) with permission from Elsevier. Full text @ Dev. Biol.