
Fig. 4
- ID
- ZDB-IMAGE-070914-43
- Genes
- Publication
- McCollum et al., 2007 - A zebrafish LMO4 ortholog limits the size of the forebrain and eyes through negative regulation of six3b and rx3
- All Figures
- Figures for McCollum et al., 2007
|
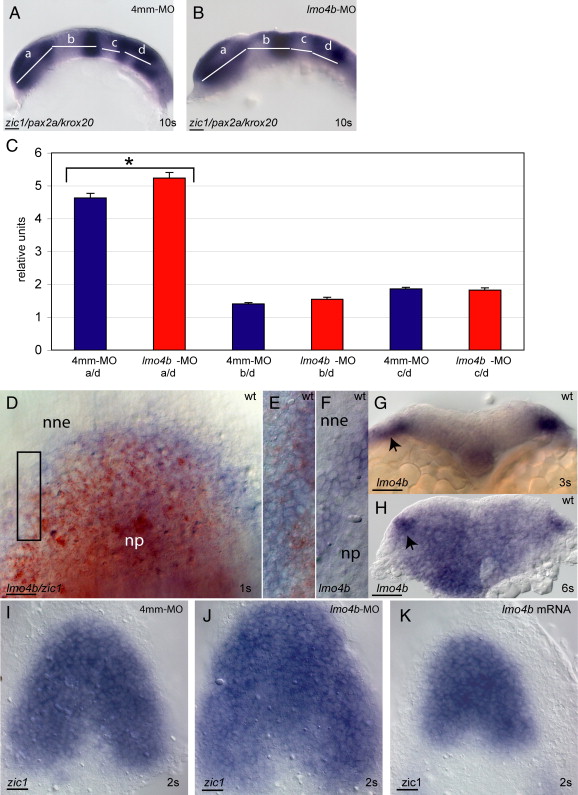
Fig. 4 Loss of lmo4b expands the anterior neural plate. (A, B) Lateral views of embryos at the 10s stage stained with the regional markers zic1, pax2a and krox20 to delineate regions that are measured and compared between control-injected (A) and morphant (B) embryos. (C) Measurements are normalized to the size of rhombomeres 3–5 (region d). Bars indicate standard error of the mean. Statistically significant differences are indicated with an asterisk. Individual values, with confidence intervals, for control (blue) and morphant (red) respectively are: a/d = 4.6 ± 0.3 and 5.2 ± 0.3; b/d = 1.4 ± 0.1 and 1.5 ± 0.1; c/d = 1.9 ± 0.01 and 1.8 ± 0.1. p values are indicated in the text. (D–F) Dorsal views of the anterior neural plate of embryos at the 1s stage, stained for expression lmo4b (blue) and zic1 (red) (D, E) or lmo4b alone (F) to mark the neural plate (np), neural boundary and non-neural ectoderm (nne). Panel E is an enlargement of the region indicated by the box in panels D and F is a similarly enlarged region from a different embryo. Panels G, H are cross-sections through the anterior neural region of wild type embryos at the 3s (G) and 6s (H) stages. Arrowheads indicate non-neural ectoderm. Panels I–K are dorsal views of the anterior neural plate stained for zic1 expression in embryos injected with 4 mm-MO (I), lmo4b-MO (J) or 750 pg lmo4b mRNA (K) at the 2s stage. Scale bars are 20 μm.
Reprinted from Developmental Biology, 309(2), McCollum, C.W., Amin, S.R., Pauerstein, P., and Lane, M.E., A zebrafish LMO4 ortholog limits the size of the forebrain and eyes through negative regulation of six3b and rx3, 373-385, Copyright (2007) with permission from Elsevier. Full text @ Dev. Biol.