
|
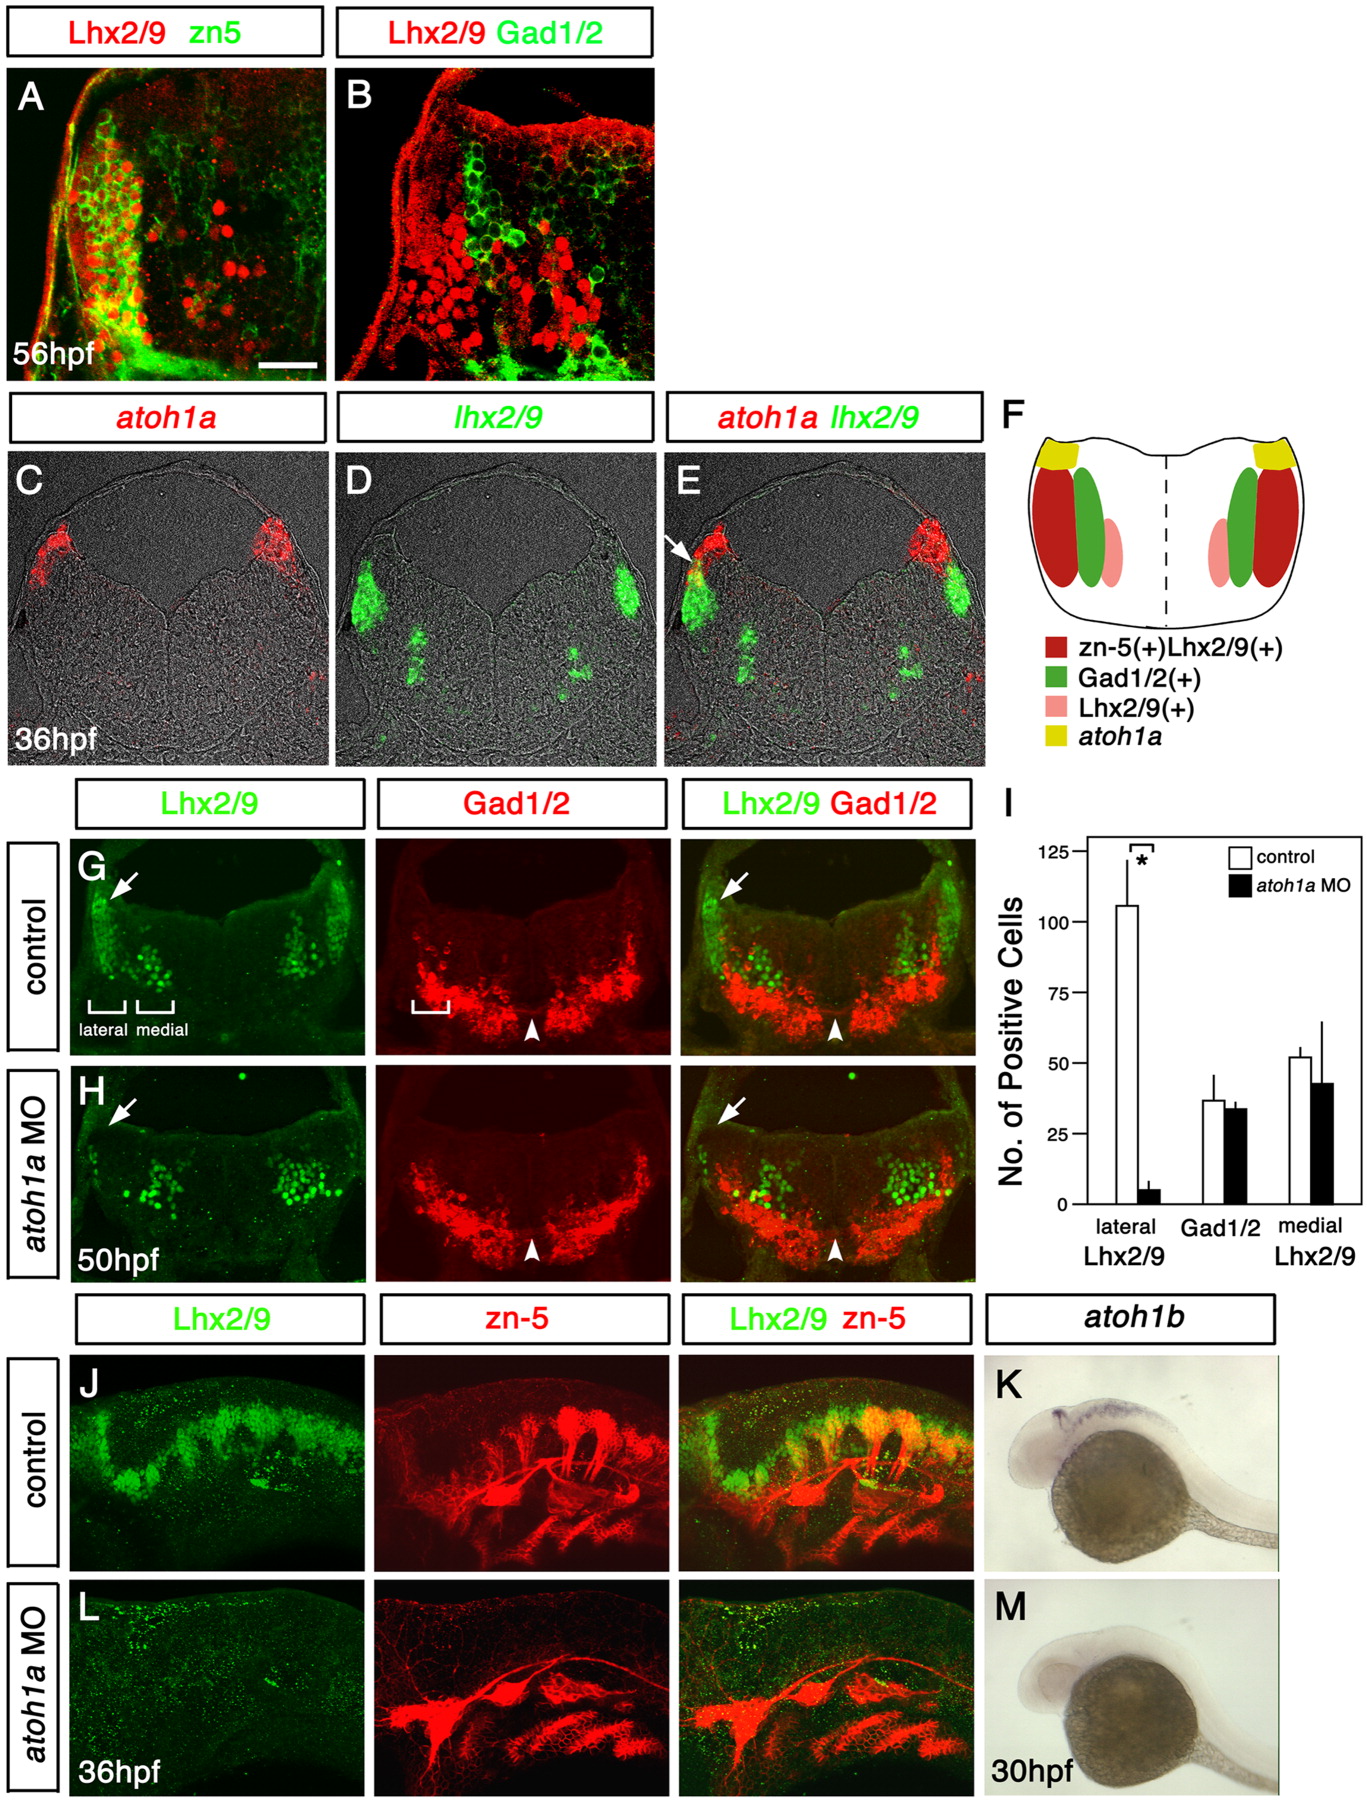
Fig. 1 Two distinct classes of neurons in the dorsal hindbrain of zebrafish embryos. A,B: Immunostaining of coronal sections of the hindbrain at the level of the otic vesicle with the Lhx2/9 (A,B), zn-5 (A), and Gad1/2 (B) antibodies. Dorsal is to the top, lateral is to the left. The lateral-most neurons express both the zn-5 antigen and Lhx2/9, while a distinct neuronal population located medially to the zn-5(+)Lhx2/9(+) neurons express Gad1/2. C-E: Fluorescent in situ hybridization of serial coronal sections (10 μm in thickness) of the hindbrain at the level of the otic vesicle with the atoh1a (C,E) and lhx2/9 (D,E) probes. Dorsal is to the top. E is a composite figure of C and D. F: Schematic illustration of gene expression profiles in the dorsolateral hindbrain. Coronal view. G,H: Coronal sections of the hindbrain of the control (G) and atoh1a morpholino (MO) -injected (H) embryos at the level of the otic vesicle, immunostained with the Lhx2/9 and Gad1/2 antibodies. Dorsal is to the top. The arrows indicate the cluster of the lateral Lhx2/9(+) neurons, which is severely reduced in number in the atoh1a MO-injected embryos. The arrowheads indicate the Gad1/2(+) commissural fascicles. The brackets indicate the regions where the cell number was counted to collect data for I. I: Cell counts (mean + SD) for lateral Lhx2/9(+), Gad1/2(+), and medial Lhx2/9(+) neurons in control and atoh1a MO-injected embryos. Lhx2/9- and Gad1/2-immunopositive cells at the level of the otic vesicle were counted bilaterally on three independent sections (20 μm in thickness) derived from different embryos. Only the number of lateral Lhx2/9(+) neurons is significantly reduced in the atoh1a MO-injected embryos. Asterisk indicates P < 0.01, Student t-test). J-M: Expression of Lhx2/9, the zn-5 antigen and atoh1b in the control (J,K) and atoh1a MO-injected (L,M) embryos was examined by immunostaining (Lhx2/9 and zn-5 antibodies) and in situ hybridization (atoh1b antisense probe). Lateral view, dorsal is to the top, anterior is to the left. All three signals were specifically abolished in the dorsolateral hindbrain of the atoh1a MO-injected embryos. Scale bars = 20 μm in A,B, 40 μm in C-E, 50 μm in G,H,J,L, 250 μm in K,M.