
|
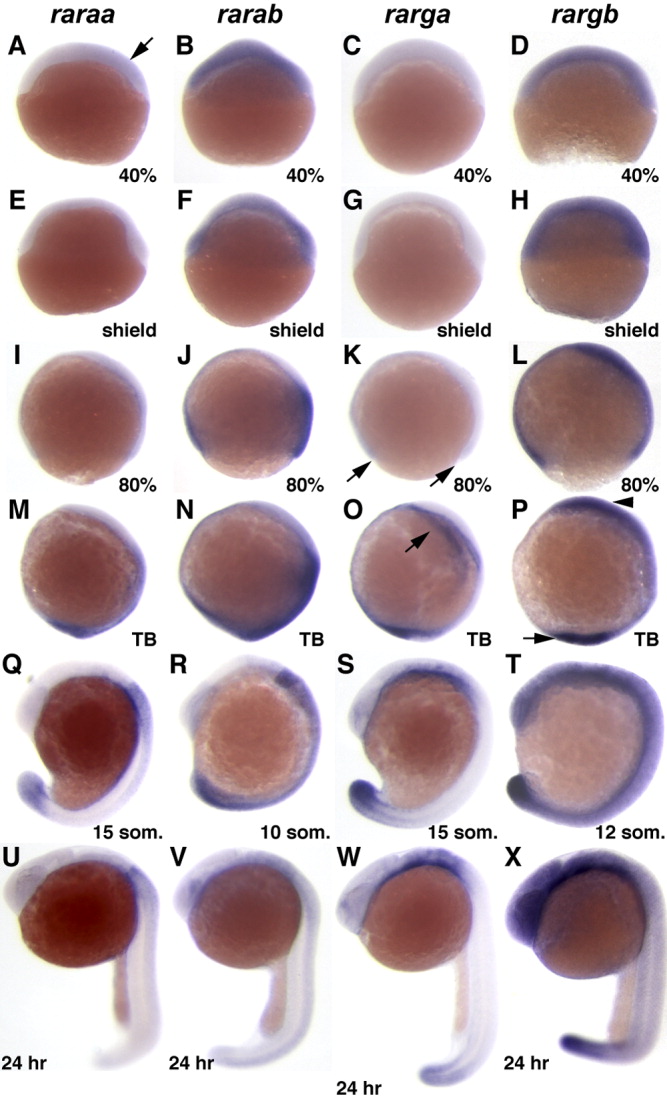
Fig. 2 Comparison of zebrafish rar expression patterns from 40% epiboly through 24 hpf. ISH depicts expression patterns of raraa, rarab, rarga, and rargb. A-D: Lateral views of embryos at 40% epiboly, animal pole at the top, dorsal on the right. Arrow in A indicates dorsal expression. E-H: Lateral views at shield stage. I-L: Lateral views at 80% epiboly. Arrows in K indicate low expression around the margin. M-P: Lateral views at the tailbud stage, anterior at the top. Arrow in O indicates anterior mesendoderm expression. Arrowhead in P indicates higher anterior expression. Arrow in P indicates tailbud expression. Q-T: Lateral views at the 15-somite stage. U-X: Lateral views at 24 hpf.