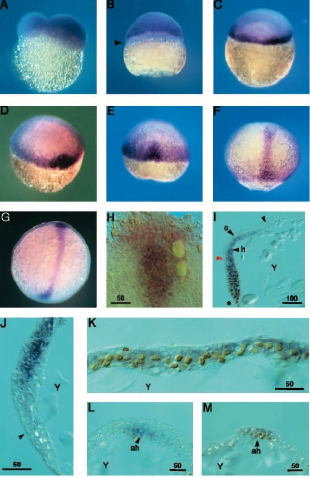
Fig. 2 (A-G) TARAM-A RNA expression in early zebrafish embryos stages. Whole-mount view from lateral (A-C), or dorsal (D-G) side; (A-F) animal pole is to the top; (G,H) anterior is to the top. (A) 2-cell-stage. (B) 500-cell stage. TARAM-A expression is fading from the marginal cells corresponding to the prospective yolk syncitial layer cells (YSL) (arrowhead). (C) Dome stage. TARAM-A expression is no longer detected in animal pole cells and is restricted to the marginal zone. (D) 40% epiboly stage. An additional domain of TARAM-A appears on the future dorsal side. (E) Shield stage. The expression in the marginal zone is fading and the TARAM-A territory expression occupies the shield area. (F) 80% epiboly stage and (G,H) 100% epiboly stage; labelling is restricted to the embryonic axis. (H) Flat-mount view of head of an embryo at the end of gastrulation labelled with gsc (red) and TARAM-A (purple). The anterior limit of TARAM-A expression is bordered by the anterior, crescent-shaped gsc domain. (I-M) Sections of embryos labelled with a TARAM-A probe (blue) and an anti-NTL antibody (nucleus in yellowish brown). (I-K) Sagittal section; (L,M) cross sections. Y indicates the position of the yolk, the black arrowheads indicate the positions of the epiblast (e) and the hypoblast (h) or axial hypoblast (ah). (I) Sagittal section through a 70% epiboly stage embryo; the asterisk indicates the blastoderm margin, the red arrowhead indicates the anterior boundary of NTL protein distribution and the blue arrowhead the anterior boundary of TARAM-A expression in the hypoblast (dorsal to the left). Brachet’s cleft, delimiting the hypoblast-epiblast boundary, is visible in the anterior part of the embryo (Kimmel et al., 1995). (J,K) Sagittal section through the head (J), or the trunk (K), of a 95% epiboly stage embryo, (J, anterior down). The head can be divided into three regions. Anterior to the blue arrowhead, where the crescent-shaped expression of gsc is detected (see H), no TARAM-A expression is detected. Posterior to the blue arrowhead, both hypoblast and epiblast weakly express TARAM-A. More posteriorly, strong TARAM-A expression is graded, with peak levels around hypoblast-epiblast boundary. Periderm is not labelled. (K; anterior left) The axial hypoblast corresponding to the future notochord expresses specifically ntl and is labelled by TARAM-A. In addition to the hypoblast the epiblast is labelled. (L,M) Transverse sections through the head (L) and the trunk (M) of a 95% epiboly stage embryo. Staining is axial in both cases. Values for scale bars are indicated in μm.
Image
Figure Caption
Figure Data
Acknowledgments
This image is the copyrighted work of the attributed author or publisher, and
ZFIN has permission only to display this image to its users.
Additional permissions should be obtained from the applicable author or publisher of the image.
Full text @ Development

