
Fig. 5
|
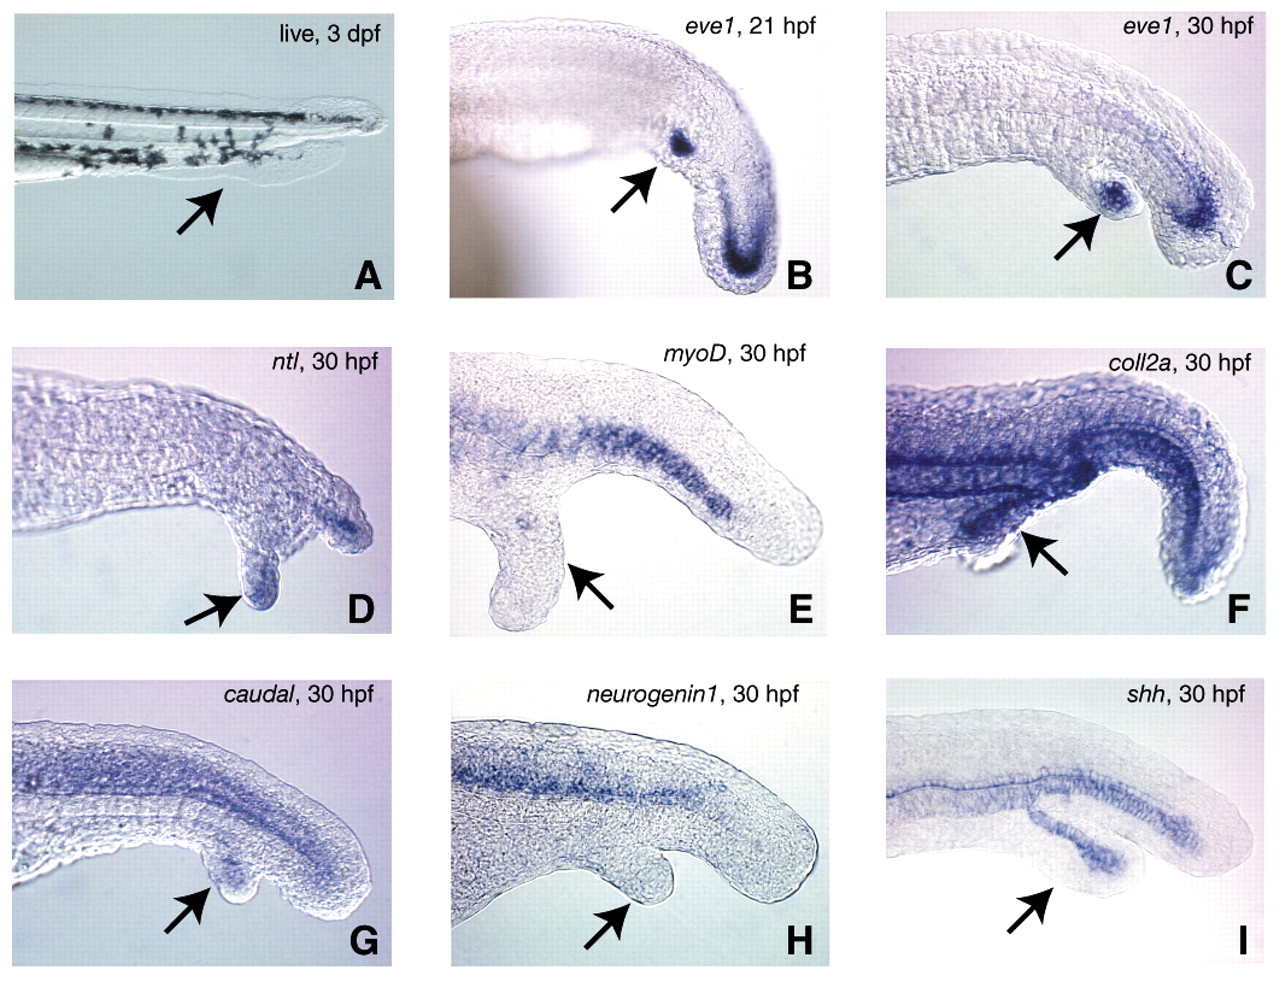
Fig. 5 Analysis of gene expression in the ectopic tails. Embryos were heatshocked from shield to bud stage to maximize ectopic tail formation, then photographed live at 3 dpf (A), or fixed at either 21 hpf (B) or 30 hpf (C-I). Expression of eve1 (B,C), no tail (ntl; D), myod (E), collagen 2a (coll2a; F), caudal (G), neurogenin1 (H), or sonic hedgehog (shh; I). Arrows in each panel indicate the location of the ectopic tail. In A note the presence of both fin and pigment tissue in the secondary tail. In all other panels except H note the expression of each corresponding gene in the ectopic tails. ntl expression in D was localized only to the tailbud of the ectopic tail. All images except I are representative of the majority of ectopic tails examined. We observed sonic hedgehog-expressing cells in 44% (n=16) of ectopic tails.