
Fig. 2
- ID
- ZDB-IMAGE-050228-10
- Genes
- Publication
- Ninkovic et al., 2005 - Inhibition of neurogenesis at the zebrafish midbrain-hindbrain boundary by the combined and dose-dependent activity of a new hairy/E(spl) gene pair
- All Figures
- Figures for Ninkovic et al., 2005
|
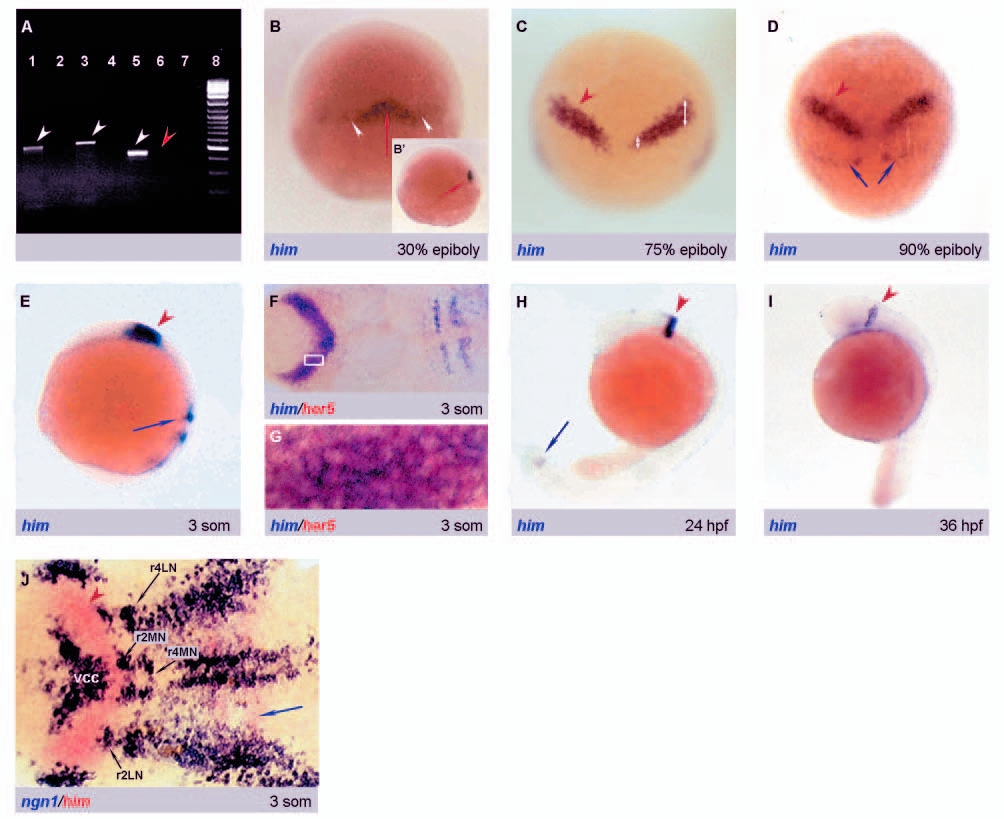
Fig. 2 him is expressed dynamically during embryonic development, in exact overlap with her5 within the midbrain-hindbrain domain. (A) Maternal expression of him and her5, revealed by RT-PCR. (1,8). (1) him specific primers with cDNA isolated from four-cell stage embryos; (2) him specific primers without cDNA; (3) her5 specific primers with cDNA isolated from four-cell stage embryos; (4) her5 specific primers without cDNA; (5) pax2.1 specific primers with cDNA isolated from three-somite stage embryos; (6) pax2.1 specific primers with cDNA isolated from four-cell stage embryos; (7) pax2.1 specific primers without cDNA; (8) 100 bp DNA ladder (Fermentas MBI). Note the selective amplification of him and her5 in lanes (1) and (3) (white arrowheads), compared to the negative control pax2.1 (red arrowhead). (B-J) him expression revealed by whole-mount ISH (probe combination color-coded and indicated at the bottom left of each panel; stages at the bottom right; (B-D) dorsal views, anterior up; (E,H,I) lateral views, anterior left; (F,G,J) dorsal views of flat-mounted embryos, anterior left). At 30% epiboly (B), him is transcribed in the deep layer of the mesoderm (red arrows, see sagittal view in B′) and in scattered cells of the dorsal embryonic margin (white arrowheads). him expression within the MH domain (red arrowheads) is initiated at 75% epiboly (C) (note the difference in expression in medial and lateral parts of the IZ is indicated with white arrows) and maintained until 36 hpf (I). Note in F (and see higher magnification of the boxed area in G) that him and her5 expression in this domain are exactly coincident. him expression in the presomitic mesoderm starts at 90% epiboly (D) (blue arrows) and is maintained until 24 hpf (H). him and ngn1 are complementarily expressed in the MH region (J). Red arrowheads indicate him expression at the MHB and blue arrows expression in the presomitic mesoderm. IZ, intervening zone; vcc, ventrocaudal cluster, r2M, presumptive motorneurons of rhombomere 2; r2L, presumptive lateral neurons of rhombomere 2; r4M, presumptive motorneurons of rhombomere 4; r4L, presumptive lateral of rhombomere 4.