
Figure 7
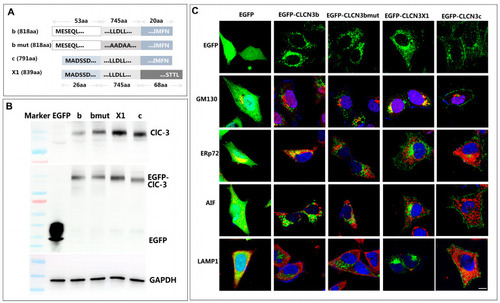
Expression of various ClC-3 isoforms in HEK293 cells. (A) Schematic map of various human ClC-3 transcripts and their structures. Only representative amino acid sequences are shown. Ellipses (“…”) indicate omitted amino acid residues not shown in the schematic sequence. (B) Western blot analysis results. The upper, middle and lower lanes were the results with antibodies against ClC-3, EGFP and GAPDH, respectively. The endogenous ClC-3 protein level was not detected in EGFP group, but the other four overexpressing groups (ClC-3b, ClC-3 bmut, ClC-3c, ClC-3X1) showed the EGFP-ClC-3 protein expression, which had minor difference in molecular size. (C) Confocal images. Green represented the location of overexpressed EGFP or EGFP fusion proteins. Red signals represented the intracellular staining of GM130, ERp72, AIF and LAMP1, respectively. Blue represents DAPI staining of cell nuclei. Colocalization was shown in yellow. Scale bars = 10 μm. |