
Fig. 8
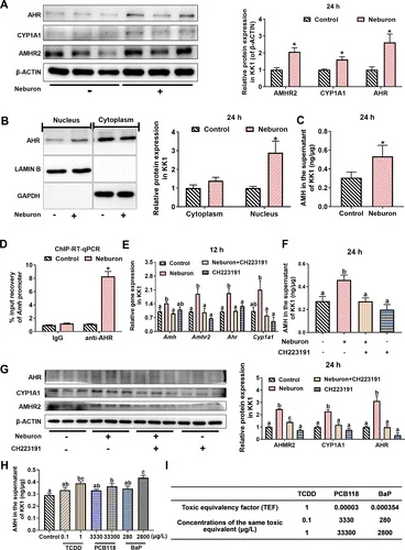
Molecular characterization of AHR-mediated AMH signaling modulation in mouse granulosa cells (KK1 cells) exposed to neburon and environmental ligands. (A) AHR, CYP1A1, and AMHR2 protein levels in KK1 cells treated with 5 mg/L neburon for 24 h (n = 3 wells/group). (B) AHR protein levels in the nucleus and cytoplasm of KK1 cells treated with 5 mg/L neburon for 24 h (n = 3 wells/group). AHR was normalized using GAPDH (cytoplasm) and LAMIN B (nucleus). (C) The protein levels of AMH in the supernatant of KK1 cells treated with 5 mg/L neburon for 24 h detected by ELISA (n = 3 wells/group). (D) The binding status of AHR and amh promoter detected by ChIP-RT-qPCR in KK1 cells treated with 5 mg/L neburon for 24 h (n = 3 wells/group). (E) The transcriptional levels of Amh, Amhr2, AHR and Cyp1a1 in KK1 cells treated with 5 mg/L neburon combined with 1 μM CH223191 for 12 h (n = 3 wells/group). (F) The protein levels of AMH in the supernatant of KK1 cells treated with 5 mg/L neburon combined with 1 μM CH223191 for 24 h (n = 6 wells/group). (G) AHR, CYP1A1, and AMHR2 protein levels in KK1 cells treated with 5 mg/L neburon combined with 1 μM CH223191 for 24 h (n = 3 wells/group). (H) The AMH protein levels in the supernatant of KK1 cells treated with tetrachlorodibenzo-p-dioxin (TCDD), polychlorinated biphenyl 118 (PCB118), and benzo[a]pyrene (BaP) for 24 h (n = 6 wells/group). (I) Conversion of toxicity equivalent factors and exposure concentrations of TCDD, PCB118, and BaP. Data are presented as the mean ± SE. For comparisons between two groups, t-test was used to assess statistical differences. For multiple comparisons involving three or more groups, one-way analysis of variance (ANOVA) followed by post hoc Duncan’s test was applied. Different letters on the bars represent statistically significant differences at p < 0.05 between groups. *p < 0.05, **p < 0.01, and ***p < 0.001. The data presented in Figure 8A-H are also displayed in Excel Table S36–43, respectively. |