
Fig. 4
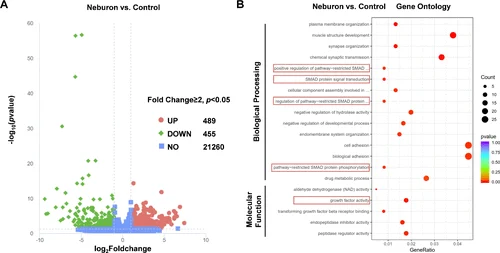
RNA-seq analysis in ovarian tissues exposed to 10 μg/L neburon for 150 days (n = 4 samples/group). (A) The volcanic maps for differentially expressed genes. Green dots represent significantly down-regulated genes, red dots represent significantly up-regulated genes, and blue dots represent genes with no significant difference between the two groups. The two vertical dotted lines indicated log2Foldchange = 1 (Fold Change = 2) and log2Foldchange = −1 (Fold Change = 0.5), respectively. The horizontal dotted line represented −log10(p-value) = 1.3 (p = 0.05) (B) The functional annotation charts derived using the Cluster Profiler R package for the differentially regulated genes in the neburon group versus the control group. Fold change ≥ 2, p < 0.05. The data presented in Figure 4A,B are also displayed in Excel Table S17 and S18, respectively. |