
Fig. 2
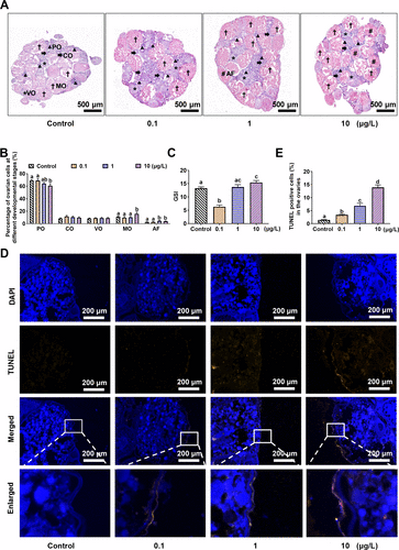
Histology of WT female zebrafish exposed to 0.1, 1, and 10 μg/L neburon for 150 days. (A) The representative ovary section stained with hematoxylin-eosin (H&E). Scale bar = 500 μm. The letters PO, CO, VO, MO, and AF next to the triangle, arrow, star, dagger maker, and pound sign indicated primary oocyte, cortical alveolar oocyte, vitellogenic oocyte, mature oocyte, and atretic follicle, respectively. (B) The proportion of the number of oocytes from each stage in each group after neburon treatment (n = 6 samples/group). (C) Gonadosomatic index (GSI) in female zebrafish (n = 30 samples/group) exposed to neburon for 150 d. (D) The representative ovary section stained with terminal dUTP nick-end labeling (TUNEL). (E) The proportion of positive cells (pink areas) in each group of ovarian sections after neburon treatment (n = 4 samples/group). The region of positive signal was magnified in the lower panel. Scale bar = 200 μm. Data are presented as the mean ± SE. Statistical analysis was performed using one-way analysis of variance (ANOVA) followed by posthoc Duncan’s test. Different letters on the bars represent statistically significant differences at p < 0.05 between groups. The data presented in Figure 2B,C,E are also displayed in Excel Table S9, S10, and S11, respectively. |