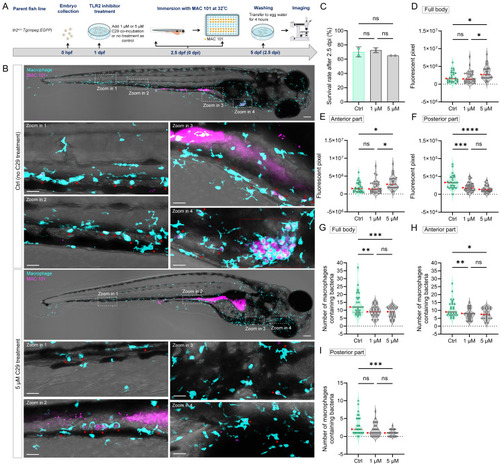
TLR2 chemical inhibition impairs macrophage-mediated dissemination of MAC 101 bacteria in zebrafish larvae. (A) Schematic of the experimental workflow. Zebrafish larvae were treated with the TLR2 inhibitor C29 at 1 dpf and then immersed with mCherry-labeled MAC 101 at 2.5 dpf for 2.5dpi. (B) Representative fluorescence images showing macrophages containing MAC 101 bacteria in different body regions in tlr2 wild-type and C29 treated larvae. Bacteria are shown in magenta. Macrophages are shown in cyan. Red dashed box represents suspected granuloma structures. Scale bar: 100 µm for full-body images; 25 µm for zooms. (C) Survival rates for all groups after MAC 101 infection showing no significant differences between the wild type and C29 treated larvae. The results are based on 3 independent experiments. Error bars represent mean ± SD. (D, E) Quantification of full body (D) and anterior region (E) bacterial burden (fluorescent pixel count) reveals significantly higher MAC 101 load in 5 µM C29 treated larvae compared to the wild type and 1 µM C29 treated larvae. (F) In the posterior body region, significantly more MAC 101 was detected in tlr2 wild-type larvae than 1 µM or 5 µM C29 treated larvae. (G-I) Quantification of the number of bacteria-containing macrophages in the full body (G), anterior region (H), and posterior region (I). Wild-type larvae had significantly more infected macrophages than 1 µM or 5 µM C29 treated larvae in full body and anterior region. For posterior region, wild-type larvae have more infected macrophages than 5 µM C29 treated larvae. Macrophages containing bacteria were manually counted across the full z-stack for each region. Each z-slice was examined to verify that individual bacteria-containing macrophages were counted once and only once. The data from tlr2+/+ wild-type (n=27) group, 1 µM C29 treated (n=31) group and 5 µM C29 treated group (n=26) are based on two independent experiments. Statistical significant difference was determined by one-way ANOVA, red arrows point to the median, ns, non-significant, *, P < 0.05, **, P < 0.01, ***, P < 0.001, ****, P < 0.0001.
|
