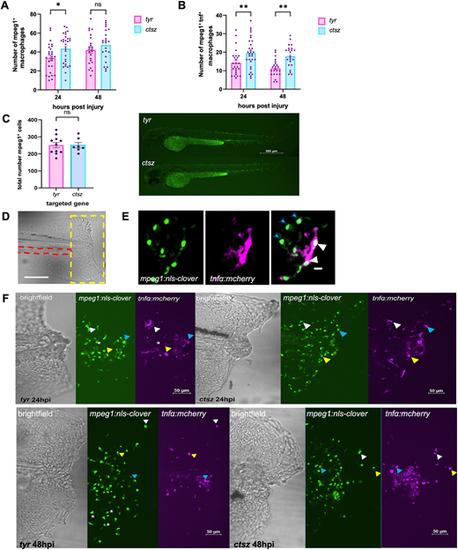
Evaluation and quantification of total and inflammatory macrophages in ctsz crispant larvae. (A,B) Quantification of the number of total macrophages (mpeg1+tnfα− cells; A) and pro-inflammatory macrophages (mpeg1+tnfα+ cells; B) in transgenic Tg(mpeg1.1:nls-clover/tnfα:mcherry) tyrosinase control animals (pink) and crispants for the ctsz gene (blue) at 24 and 48 hpi. Each point represents a single larva. Data represent three independent repeats; ns, not significant; *P<0.05; **P<0.01 (two-way ANOVA with Bonferroni post-test). (C) Counts of macrophages in unstimulated 2 dpf tyr (ten larvae) or ctsz (seven larvae) crispants with representative images, analysed by unpaired two-tailed t-test. Scale bar: 500 µm. (D) Representative image of the tailfin wound site of tyr control and ctsz crispant larvae obtained by confocal microscopy. Red dashed line indicates the circulation loop; yellow dashed yellow line indicates the region of the tailfin wound in which macrophages were imaged in subsequent images. Scale bar: 100 µm. (E) Representative images of macrophage (green) and tnfα (magenta) expression. Scale bar: 10 µm. (F) Representative images of the caudal inflammatory region, macrophage (green) and tnfα (magenta) expression of tyr control (top row) and ctsz crispant animals (bottom row) at 24 and 48 hpi. White, yellow and blue arrowheads indicate dual expression of mpeg1 and tnfα. Asterisk indicates cells with no tnfα expression. Scale bars: 50 µm.
|
