FIGURE

Fig. 7

ID
ZDB-FIG-260505-102
Publication
Li et al., 2026 - Screening and characterization of a novel cupin-like polypeptide from Oyster (Ostrea gigas) and its anti-inflammatory effect via TAK1 mediated NF-κB pathway
Other Figures
All Figure Page
Back to All Figure Page
Fig. 7

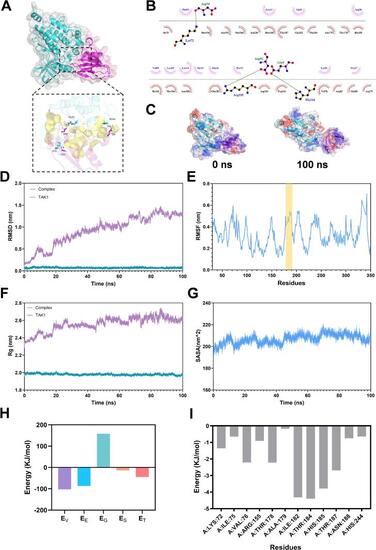
Analysis of molecular dock and molecular dynamics simulations of OGP1-1 binding to TAK1 (PDB 5V5N). (A) Molecular docking of OGP1-1 (purple) and TAK1 (cyan). The yellow spheres represent the hydrophobic interaction interface. (B) Binding modes of OGP1-1 with TAK1. Green dot lines represent hydrogen bond. Red eyelash curves represent hydrophobic interaction. (C) Conformation of OGP1-1 (purple) at 0 ns and 100 ns in MD simulations. (D) RMSD fluctuations of TAK1 backbone atoms and complex during the 100 ns MD simulation. (E) RMSF of TAK1 Cα atoms. (F) Rg plot. (G) Average SASA plot. (H) Binding free energy calculated using MM-GBSA analysis of the final 100 ns MD simulation. (I) Residue energy contribution decomposition based on the final 100 ns MD simulation. Abbreviations: Et: total binding energy; Ev: van der Waal energy; Ee: electrostatic energy; Es: Solvent accessible surface area energy; Ep: Polar solvation energy. (For interpretation of the references to colour in this figure legend, the reader is referred to the web version of this article.)

Expression Data

Expression Detail
Antibody Labeling
Phenotype Data

Phenotype Detail
Acknowledgments
This image is the copyrighted work of the attributed author or publisher, and ZFIN has permission only to display this image to its users. Additional permissions should be obtained from the applicable author or publisher of the image. Full text @ Food Chem X