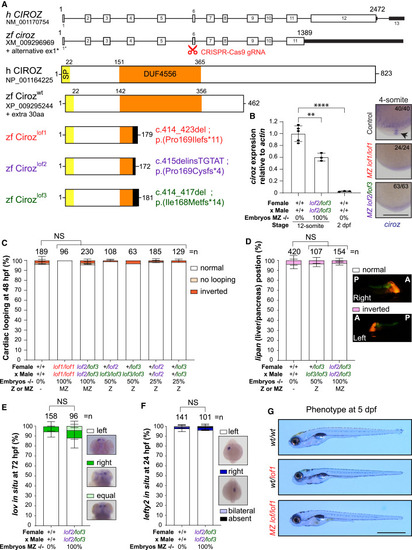
Zebrafish without Ciroz do not exhibit LR defects (A) Depiction of genomic and protein structures of human and zebrafish Ciroz. The zebrafish sequence used is Genbank: XM_009296969/XP_009295244 using the alternate exon 1 (ex1∗) described in Figure S5. Ciroz protein domains are highlighted: signal peptide (SP; yellow) and DUF44556 (domain of unknown function, orange). The site targeted by the CRISPR gRNA is indicated by the red pair of scissors in exon 6. Three different alleles, lof1 (red), lof2 (purple), and lof3 (green), were obtained, all leading to a frameshift (black) with an early stop codon. aa, amino acid; h, human; lof, loss-of-function; zf, zebrafish; wt, wild type. (B) Left: qPCR for ciroz relative to actin at indicated stages. Data are mean ± SEM. ∗∗p = 0.0016 and ∗∗∗∗p < 0.0001. One-way ANOVA with Tukey’s test for multiple comparisons. n = at least 3 biological replicates of 30–50 embryos. dpf, days postfertilization. Right: whole-mount ciroz in situ hybridization in zebrafish embryos from indicated crosses at the 4-somite stage. Zooms on the Kupffer’s vesicles (KV) are shown. Black arrow points to expression in the KV of control embryos. The number of analyzed embryos is indicated. Scale bar, 0.25 mm. (C) Scoring of cardiac looping at 48 hpf of embryos from indicated crosses. Genotypes of the parents and percentage of ciroz−/− embryos are indicated. Normal, no, or inverted looping is classified in white, light orange, or dark orange, respectively. n = total number of embryos analyzed from at least 3 independent experiments. Data are mean ± SEM. NS, not significant. Two-way ANOVA with Tukey’s test for multiple comparisons (normal looping condition). Z, zygotic; MZ, maternal zygotic. (D) Scoring of liver (red) and pancreas (green) positions using the LiPan transgenic line in embryos from indicated crosses. Genotypes of the parents and percentage of ciroz−/− embryos are indicated. Normal position (liver on the left and pancreas on the right) and inverted position are classified in white and pink, respectively. n = total number of embryos analyzed from at least 3 independent experiments. Data are mean ± SEM. NS, not significant. Two-way ANOVA with Tukey’s test for multiple comparisons (normal condition). Images are side views of embryos (right or left as indicated). P, posterior; A, anterior. (E) Scoring of stronger lov expression side at 72 hpf of embryos from indicated crosses. Genotypes of the parents and percentage of ciroz−/− embryos are indicated. Left (normal), right, or equal are classified in white, dark green, and light green, respectively. n = total number of embryos analyzed from at least 3 independent experiments. Data are mean ± SEM. NS, not significant. Two-way ANOVA with Tukey’s test for multiple comparisons (normal condition). (F) Scoring of lefty2 expression side at 24 hpf of embryos from indicated crosses. Genotypes of the parents and percentage of ciroz−/− embryos are indicated. Left (normal), right, bilateral, or absent are classified in white, dark blue, light blue, or black, respectively. n = total number of embryos analyzed from at least 3 independent experiments. Data are mean ± SEM. NS, not significant. Two-way ANOVA with Tukey’s test for multiple comparisons (normal condition). (G) Absence of external phenotype at 72 hpf. Z, zygotic; MZ, maternal zygotic. Scale bar, 1 mm.
|
