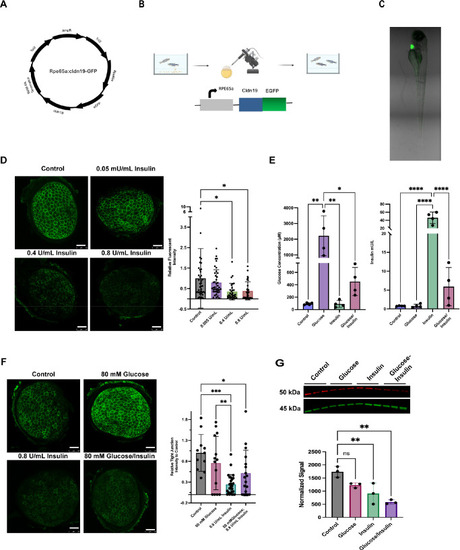
Insulin causes claudin-19 breakdown in vivo. (A) Schematic of the EGFP–claudin-19 construct. (B) Generation of Tg(rpe65a:cldn19-EGFP) transgenic zebrafish. (C) Transgenic larvae at 122 hours post-fertilization showed the EGFP heart marker indicating transgenesis. (D) Immunofluorescence of claudin-19 expression in the RPE after 72 hours under different insulin conditions. Quantification is shown at the right, with data expressed as mean ± SD (n = 31–40 eyes). Scale bar: 50 µm. *P < 0.0051 (one-way ANOVA with Barlett's test). (E) Glucose uptake (glucose assay) and insulin levels (ELISA), shown as mean ± SD (n = 4). Scale bar: 50 µm. Glucose uptake: *P < 0.0015; **P < 0.0015 (one-way ANOVA with Brown–Forsythe test). Insulin levels: ****P < 0.0001 (ELISA). (F) Claudin-19 expression in larvae under control, glucose, insulin, and insulin plus glucose. Each dot represents one eye. Scale bar: 50 µm. *P < 0.0051; **P < 0.00150; ***P < 0.0004 (ordinary one-way ANOVA with Brown–Forsythe test). (G) Western blot analysis of 6 dpf larvae under control, glucose, insulin, and insulin plus glucose treatment. *P < 0.03; **P < 0.01 (one way ANOVA with Tukey's multiple comparison test).
|
