FIGURE

Figure 3.

ID
ZDB-FIG-260423-56
Publication
Hernandez et al., 2026 - Insulin Induces Outer Blood-Retinal Barrier Disruption via Downregulation of Claudin-19
Other Figures
All Figure Page
Back to All Figure Page
Figure 3.

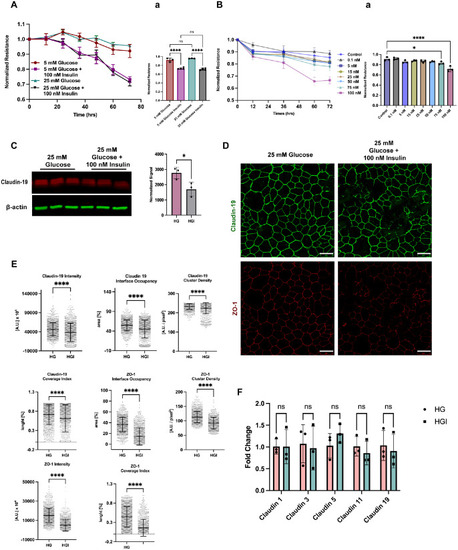
Insulin induces oBRB breakdown regardless of glucose concentration. (A) Real-time impedance of RPE monolayers treated with 5- or 25-mM glucose ± 100-nM insulin. Endpoint quantification is shown as mean ± SD (n = 3). ****P < 0.0001 (one-way ANOVA with Brown–Forsythe test and Tukey's test). (B) Dose-dependent effect of insulin (0.1–100 nM) on RPE impedance. Quantified endpoints are shown as mean ± SD (n = 3 or 4). *P < 0.05; ****P < 0.0001 (one-way ANOVA with Brown-Forsythe correction and Dunnett's test). (C) Western blot of RPE cells treated with 25-mM glucose ± 100-nM insulin, expressed as mean ± SD (n = 3). *P < 0.05 (unpaired two-tailed t-test). (D) Immunofluorescence for claudin-19 and ZO-1 under the same conditions. Scale bar: 25 µm. (E) Quantification of junctional parameters using Junction Mapper, expressed as mean ± SD (n = 1099). ****P < 0.0001 (unpaired t-test). (F) RT-qPCR of claudin transcripts normalized to GAPDH and inter-claudin expression, reported as mean ± SD (n = 3). (two-way ANOVA with Sidak's correction); ns, not significant. HG, high glucose; HGI, high glucose insulin.

Expression Data

Expression Detail
Antibody Labeling
Phenotype Data

Phenotype Detail
Acknowledgments
This image is the copyrighted work of the attributed author or publisher, and ZFIN has permission only to display this image to its users. Additional permissions should be obtained from the applicable author or publisher of the image. Full text @ Invest. Ophthalmol. Vis. Sci.