FIGURE

Figure 2

ID
ZDB-FIG-260416-51
Publication
Anderson et al., 2026 - Tissue-Specific Expression of the EWSR1::FLI1 Fusion Protein Identifies col2a1a-Positive Cells as a Source of Ewing Sarcoma-like Tumors in Zebrafish
Other Figures
All Figure Page
Back to All Figure Page
Figure 2

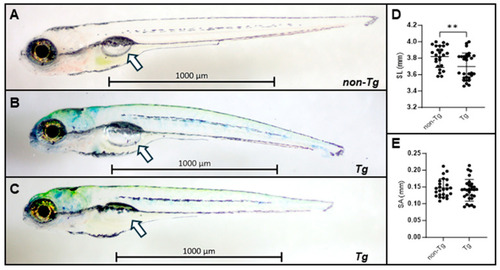
Morphologic characterization of transgenic EWSR1::FLI1 zebrafish. (A) Phenotypic characterization of non-transgenic siblings at 6 dpf. (B,C) Phenotypic characterization of Tg(col2a1a:EWSR1FLI1:pA) at 6 dpf. The white arrows indicate the swim bladder. The bubble characterizing the seim bladder is greatly diminished in panel (C). (D) Quantification of standard length (SL) in transgenic (n = 29) and non-transgenic (n = 25) larvae at 6 dpf. For non-transgenic fish, the SL is 3.82 ± 0.13 mm, and 3.70 ± 0.16 mm for transgenic fish; ** p < 0.01 by unpaired Student’s t-test. (E) Quantification of surface area (SA) of swim bladder in transgenic (n = 29) larvae with swim bladder and non-transgenic (n = 24) larvae at 6 dpf. Only living fish for each condition were studied. For non-transgenic fish, the SA is 0.147 ± 0.027 mm, and 0.143 ± 0.03 for transgenic fish; p = 0.423. The EWSR1::FLI1 transgenic fish were smaller in standard length. Because the immature swim bladders did not statistically differ between the lines at 6 dpf and the gross morphology showed no difference, we conclude that the smaller standard length was not due to a developmental factor.

Expression Data

Expression Detail
Antibody Labeling
Phenotype Data

Phenotype Detail
Acknowledgments
This image is the copyrighted work of the attributed author or publisher, and ZFIN has permission only to display this image to its users. Additional permissions should be obtained from the applicable author or publisher of the image. Full text @ Int. J. Mol. Sci.