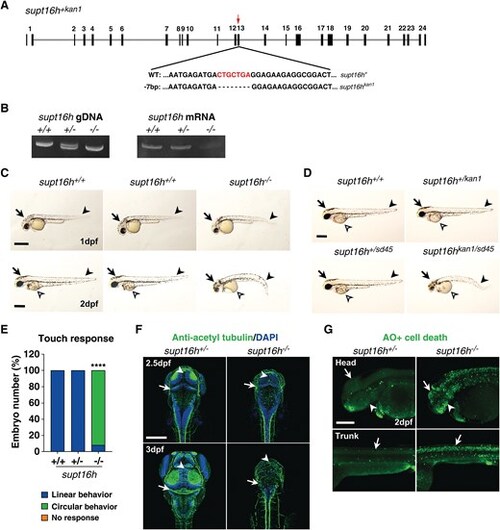
The zebrafish supt16hkan1/kan1 mutant recapitulates patient phenotypes and induces apoptosis in the central nervous system and pharyngeal arches. (A) Schematic representation of the zebrafish supt16hkan1 mutant generated by CRISPR/Cas9, highlighting the guide RNA target site (red arrow) with a 7 bp deletion within exon 13 of the supt16h gene. Black boxes indicate exons. (B) Genomic DNA (gDNA) analysis of supt16h+/kan1 (supt16h+/−) embryos showing two bands corresponding to WT and mutant alleles (left). Mutant RNA exhibits marked decay in both supt16h+/kan1 (supt16h+/−) and supt16hkan1/kan1 (supt16h−/−) embryos at 2 dpf (right; Fig. S1). (C) Bright-field lateral images of supt16h+/− and supt16h−/− embryos at 1 and 2 dpf. Arrow, head; arrowhead, tail; open arrowhead, yolk. Scale bars, 400 μm; n ≥ 30 embryos per group. (D) Target specificity of supt16h gRNA validated by comparing morphological phenotypes of supt16hkan1/sd41 compound mutants with homozygous mutants at 2 dpf. Scale bars, 400 μm. (E) Touch-evoked response of 2 dpf supt16h embryos showing locomotor abnormalities in supt16h−/− larvae. Data are presented as mean values; n ≥ 30 embryos per group. (F) Immunohistochemistry with anti-acetylated tubulin antibody (pan-neuronal marker) visualizing axonal projections in the developing brain of supt16h+/− and supt16h−/− embryos at 2.5 and 3 dpf. Arrowhead, midline-crossing axons in the midbrain; arrow, cerebellum. (G) Lateral views of live 2 dpf embryos stained with acridine orange showing apoptotic cells in the brain (arrow), pharyngeal arches (arrowhead), and spinal cord (arrow). Scale bars, 200 μm. Statistical significance was determined using one-way ANOVA followed by Dunnett’s multiple comparison test; ****P < 0.0001. Abbreviations: CNS, central nervous system; CRISPR, clustered regularly interspaced short palindromic repeats; dpf, days post-fertilization; gDNA, genomic DNA; supt16h, suppressor of ty 16 homolog; WT, wild type.
|
