FIGURE

Figure 4

ID
ZDB-FIG-260401-86
Publication
Gao et al., 2026 - Glycosylation-Related Gene Signature Identifies MFNG as a Key Driver of Proliferation and Metastasis in Colorectal Cancer
Other Figures
All Figure Page
Back to All Figure Page
Figure 4

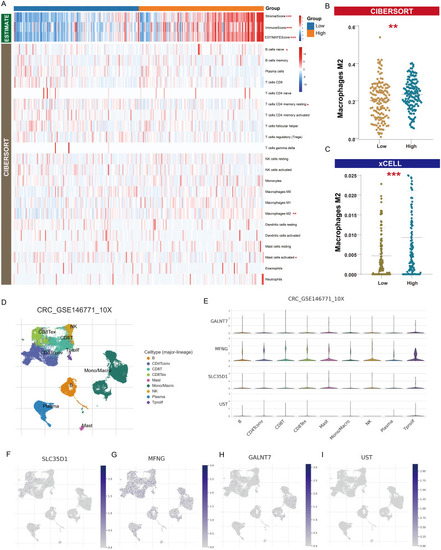
Correlation of GRGS with the immune microenvironment in colorectal cancer. (A) Heatmap showing ESTIMATE-derived Immune Score, Stromal Score and ESTIMATE Score alongside CIBERSORT-inferred proportions of 22 immune cell types in GRGS-High versus GRGS-Low groups. (B and C) Boxplots of and M2 macrophage abundances estimated by (B) CIBERSORT and (C) xCELL. (D) t-SNE plot of major immune and stromal cell clusters in the CRC_GSE146771_10X scRNA-seq dataset. (E) Violin plots comparing expression levels of GALNT7, MFNG, SLC35D1 and UST across identified cell lineages. (FI) Gene-specific t-SNE overlays showing the spatial distribution of SLC35D1 (F), MFNG (G), GALNT7 (H) and UST (I) within the single-cell atlas. **, p < 0.01; ***, p < 0.001.

Expression Data

Expression Detail
Antibody Labeling
Phenotype Data

Phenotype Detail
Acknowledgments
This image is the copyrighted work of the attributed author or publisher, and ZFIN has permission only to display this image to its users. Additional permissions should be obtained from the applicable author or publisher of the image. Full text @ Onco Targets Ther