|
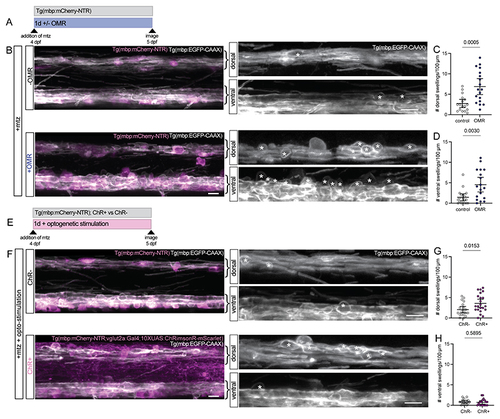
Neuronal activity exacerbates myelin swelling in zebrafish (A) Schematic of experimental timings for stimulating swimming activity in zebrafish using the optomotor response (OMR) in the Tg(mbp:mCherry-NTR) model. (B) Confocal images of myelin (grey) and oligodendrocytes (magenta) in the dorsal and ventral spinal cord in Tg(mbp:EGFP-CAAX; mbp:mCherry-NTR) animals at 5 dpf following 1 day of treatment with mtz, +/- OMR. Asterisks = myelin swellings. Scale bars = 10 μm. (C) Quantification of the number of swellings in the dorsal spinal cord at 5 dpf following 1 day of treatment with mtz, +/- OMR. Data are normalised to 100 µm length of spinal cord. Unpaired t-test with Welch’s correction. Error bars are mean ± 95% CI. (D) Quantification of the number of swellings visible above the ventral spinal cord at 5 dpf following 1 day of treatment with mtz, +/- OMR. Data are normalised to 100 µm length of spinal cord. Unpaired t-test with Welch’s correction. Error bars are mean ± 95% CI. (E) Schematic of experimental timings for optogenetic stimulation of ChR-expressing glutamatergic neurons in the Tg(mbp:mCherry-NTR) model. (F) Confocal images of myelin (grey) and ChR+ glutamatergic neurons and oligodendrocytes (magenta) in the dorsal and ventral spinal cord in Tg(mbp:EGFP-CAAX; mbp:mCherry-NTR) animals at 5 dpf following 1 day of treatment with mtz and optogenetic stimulation. Asterisks = myelin swellings. Scale bars = 10 μm. (G) Quantification of the number of swellings in the dorsal spinal cord at 5 dpf following 1 day of treatment with mtz and optogenetic stimulation. Data are normalised to 100 µm length of spinal cord. Unpaired t-test with Welch’s correction. Error bars are mean ± 95% CI. (H) Quantification of the number of swellings counted above the ventral spinal cord at 5 dpf following 1 day of treatment with mtz and optogenetic stimulation. Data are normalised to 100 µm length of spinal cord. Unpaired t-test with Welch’s correction. Error bars are mean ± 95% CI.
|