IMAGE

Fig. 2

ID
ZDB-IMAGE-260319-51
Source
Figures for Arafa et al., 2026
Image
Figure Caption

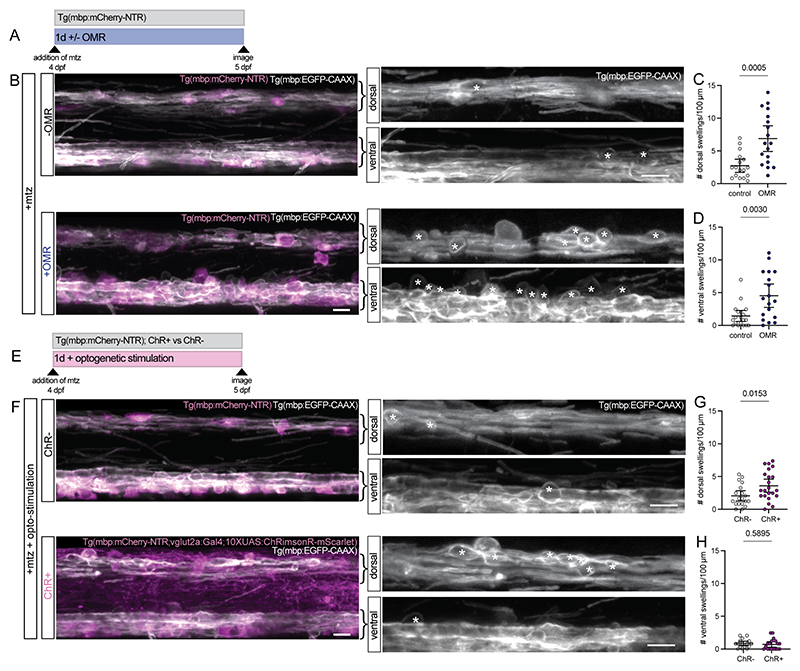
Fig. 2 Neuronal activity exacerbates myelin swelling in zebrafish

(A) Schematic of experimental timings for stimulating swimming activity in zebrafish using the optomotor response (OMR) in the Tg(mbp:mCherry-NTR) model.

(B) Confocal images of myelin (grey) and oligodendrocytes (magenta) in the dorsal and ventral spinal cord in Tg(mbp:EGFP-CAAX; mbp:mCherry-NTR) animals at 5 dpf following 1 day of treatment with mtz, +/- OMR. Asterisks = myelin swellings. Scale bars = 10 μm.

(C) Quantification of the number of swellings in the dorsal spinal cord at 5 dpf following 1 day of treatment with mtz, +/- OMR. Data are normalised to 100 µm length of spinal cord. Unpaired t-test with Welch’s correction. Error bars are mean ± 95% CI.

(D) Quantification of the number of swellings visible above the ventral spinal cord at 5 dpf following 1 day of treatment with mtz, +/- OMR. Data are normalised to 100 µm length of spinal cord. Unpaired t-test with Welch’s correction. Error bars are mean ± 95% CI.

(E) Schematic of experimental timings for optogenetic stimulation of ChR-expressing glutamatergic neurons in the Tg(mbp:mCherry-NTR) model.

(F) Confocal images of myelin (grey) and ChR+ glutamatergic neurons and oligodendrocytes (magenta) in the dorsal and ventral spinal cord in Tg(mbp:EGFP-CAAX; mbp:mCherry-NTR) animals at 5 dpf following 1 day of treatment with mtz and optogenetic stimulation. Asterisks = myelin swellings. Scale bars = 10 μm.

(G) Quantification of the number of swellings in the dorsal spinal cord at 5 dpf following 1 day of treatment with mtz and optogenetic stimulation. Data are normalised to 100 µm length of spinal cord. Unpaired t-test with Welch’s correction. Error bars are mean ± 95% CI.

(H) Quantification of the number of swellings counted above the ventral spinal cord at 5 dpf following 1 day of treatment with mtz and optogenetic stimulation. Data are normalised to 100 µm length of spinal cord. Unpaired t-test with Welch’s correction. Error bars are mean ± 95% CI.

Acknowledgments
This image is the copyrighted work of the attributed author or publisher, and ZFIN has permission only to display this image to its users. Additional permissions should be obtained from the applicable author or publisher of the image. Full text @ Science