|
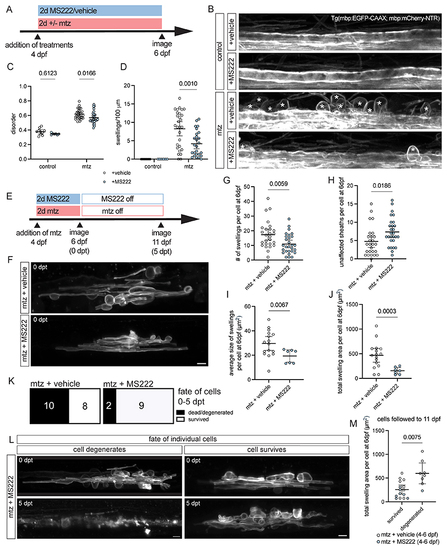
Pharmacological inhibition of voltage-gated Na+ channels mitigates myelin swelling in zebrafish (A) Schematic of experimental set-up for MS222 treatment in the Tg(mbp:mCherry-NTR) model (B) Confocal images of all myelin sheaths in the ventral spinal cord labelled by the transgenic reporter Tg(mbp:EGFP-CAAX) from Tg(mbp:mCherry-NTR)-expressing animals treated with or without 5mM mtz for 2 days, with or without treatment with MS222 for 2 days. Asterisks = swellings. Scale bar = 10 µm. (C) Quantification of disorder in the ventral spinal cord post-treatment in controls + vehicle (n = 10 animals), controls + MS222 (n = 7 animals), mtz + vehicle (n = 29 animals), or mtz + MS222 (n = 27 animals). Two Way ANOVA with Šídák’s multiple comparisons test. Error bars are mean ± 95% CI. (D) Quantification of the number of swellings in the ventral spinal cord post-treatment in controls + vehicle (n =10 animals), controls + MS222 (n =6 animals), mtz + vehicle (n = 28 animals), or mtz + MS222 (n = 26 animals). Data are normalised to 100 µm length of spinal cord. Unpaired t-test with Welch’s correction (as values for DMSO-treated groups all = 0). (E) Schematic of experimental set-up for MS222 treatment in the Tg(mbp:mCherry-NTR) model for following fate of single oligodendrocytes 5 days post treatment (dpt). dpf = days post fertilisation. (F) Confocal images of myelin sheaths in single oligodendrocytes in the ventral spinal cord mosaically labelled with (mbp:EGFP-CAAX) from Tg(mbp:mCherry-NTR)-expressing animals treated with mtz + vehicle or mtz + MS222 immediately post treatment (0 dpt). Scale bar = 5µm. (G) Quantification of number of swellings per cell immediately post treatment with mtz + vehicle (n=26) or mtz + MS222 (n=28). One cell per animal. Unpaired two-tailed t-test with Welch’s correction. Error bars are mean ± 95% CI. (H) Quantification of number of unaffected myelin sheaths (myelin sheaths with no swellings) per cell immediately post treatment with mtz + vehicle (n=26) or mtz + MS222 (n=28). Unpaired two-tailed t-test with Welch’s correction. Error bars are mean ± 95% CI. (I) Quantification of average size of swelling per cell immediately post treatment with mtz + vehicle (n=16) or mtz + MS222 (n=7). Unpaired two-tailed t-test with Welch’s correction. Error bars are mean ± 95% CI. (J) Quantification of total swelling area per cell immediately post treatment with mtz + vehicle (n=16) or mtz + MS222 (n=7). Unpaired two-tailed t-test with Welch’s correction. Error bars are mean ± 95% CI. (K) Quantification of number of oligodendrocytes that degenerated or survived following treatment with mtz + vehicle (n=18) or mtz + MS222 (n=11). Chi-square test P value = 0.0474. (L) Confocal images of myelin sheaths in single oligodendrocytes in the ventral spinal cord followed over time with treatment of mtz + MS222. Scale bar = 5µm. (M) Quantification of total swelling area per cell immediately post treatment with mtz + vehicle (clear datapoints) or mtz + MS222 (blue datapoints), separated into oligodendrocytes that survived (n=15) vs. degenerated (n=8). Unpaired two-tailed t-test with Welch’s correction. Error bars are mean ± 95% CI.
|