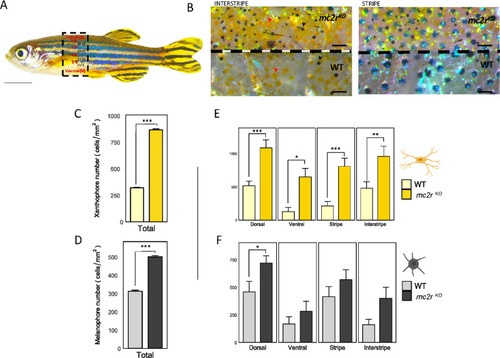
Dorso-ventral and stripe-interstripe distributions of melanophore and xanthophore cells in WT and mc2rKO fish. (A) Lateral view of a zebrafish highlighting the selected stripes (2D, 1D, 1V, 2V), interstripe (2D-1D, 1D-1V, 1V–2V, 2V-V), dorsal (D) and ventral (V) regions in red, and the interstripe areas for cell counting in black. (B) Density and distribution of melanophores (black arrowhead) and xanthophores (red arrowhead) in an interstripe (left) of mc2rKO mutant (top) and WT fish (bottom) and a stripe (right) of mc2rKO mutant (top) and WT fish (bottom). (C) Total number of xanthophores/mm2 over the entire lateral flank of the wild type (light yellow) and the mc2rKO mutant (dark yellow). (D) Total number of melanophores/mm2 over the entire lateral flank of the WT (gray) and the mc2rKO mutant (black). (E) Quantification of xanthophores in the dorsal, ventral, stripe and interstrip regions in the WT (light yellow) and mc2rKO mutant (dark yellow) strains. (F) Number of melanophores/mm2 in the dorsal, ventral, striped and interstripe regions in the WT (gray) and mc2rKO mutants (black). The data are presented as the means ± SEMs, n = 3. Asterisks indicate significant differences between the WT and the mc2rKO mutant. Two-tailed Student’s t test was used to compare different body stripes between WT and mc2rKO fish to determine the significant differences in pigments (*, P < 0.05; **, P < 0.01; ***, P < 0.001). Scale bars: (A) 5 mm, (B) 2 mm. The cell figures were provided by BioRender.com.
|
