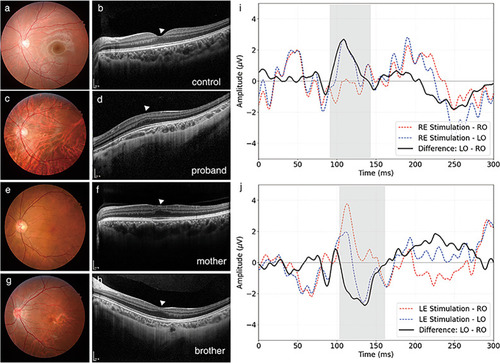
Fundus photographs and OCT images of an age- and sex-matched control of the proband and affected members of the OCA family. (a,b) Foveal pigmentation and foveal reflex were observed, and OCT showed a normal foveal pit (arrowhead) in an unrelated healthy control subject. These images serve as a reference for comparison with affected family members. (c, d) Fundus photography of the proband revealed no foveal reflex, but OCT showed grade 2 foveal hypoplasia. No foveal pit was observed. (e, f) Fundus photography of the affected mother showed a weak foveal reflex, and OCT revealed grade 1b fovea hypoplasia. A shallow foveal pit was noted. (g, h) Fundus photography of the affected brother showed a weak foveal reflex, and OCT revealed grade 1a foveal hypoplasia. A shallow foveal pit and retention of the inner retinal layer at the fovea center were observed. (i, j) Multichannel pattern visual evoked potential (VEP) analysis of the proband. The graphs show waveforms recorded from the right occipital (RO, red dashed lines) and left occipital (LO, blue dashed lines) electrodes, together with their difference wave (solid black line), following pattern stimulation of the right eye (RE) and left eye (LE). The LO–RO difference wave shows a prominent positive peak in the P100 latency region during RE stimulation and a negative peak during LE stimulation, indicating chiasmal misrouting with crossed asymmetry (highlighted in gray).
|
