
FIGURE
Figure 8
Figure 8
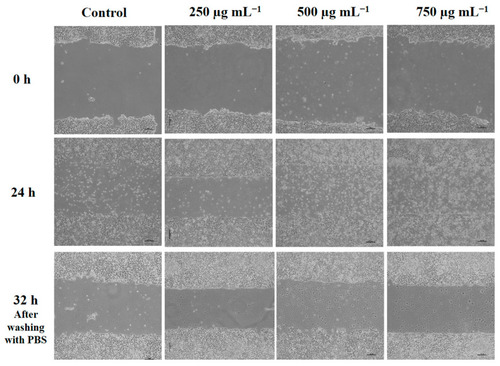
Representative images of the scratch wound healing process at 0, 24, and 32 h. The images demonstrate the progressive closure of the wound over time at varying concentrations: control, 250, 500, and 750 µg mL−1. All images were acquired at the same magnification. Scale bar: 100 µm. |
Expression Data
Expression Detail
Antibody Labeling
Phenotype Data
Phenotype Detail
Acknowledgments
This image is the copyrighted work of the attributed author or publisher, and
ZFIN has permission only to display this image to its users.
Additional permissions should be obtained from the applicable author or publisher of the image.
Full text @ Molecules