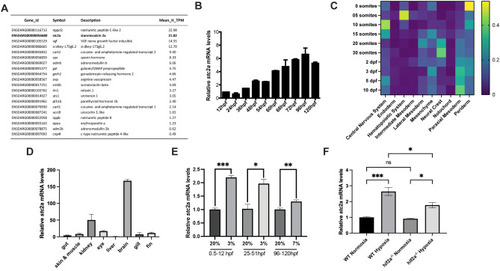
Identification of stc2a as a hypoxia-inducible gene. (A) List of genes enriched in the GO term hormone activity. mRNA abundance is ranked by mean transcripts per million (TPM) in the hypoxia group. (B) qRT-PCR analysis results of stc2a mRNA expression at the indicated developmental stages. hpf, hour post fertilization. Data are shown as mean ± SEM. n = 10-15. (C) Relative stc2a mRNA expression extracted from Zebrahub scRNA-seq database. (D) Levels of stc2a mRNA in the indicated adult tissues. RNA was extracted from the indicated tissues and analyzed by RT-qPCR analysis and normalized by 18s rRNA. Data are shown as mean ± SEM. n = 3. (E) qPCR analysis result of stc2a mRNA expression. Fish were subjected to hypoxia at the indicated air O2 levels and periods. RNA was isolated and stc2a mRNA levels examined by RT-qPCR and normalized by β-actin mRNA levels. Note: Because 3% O2 is lethal for advanced larvae, 7% O2 was used in the 96–120 hpf group. Data are shown as mean ± SEM. *p < 0.05, **p < 0.01, ***p < 0.001, t-test. n = 3-4. (F) Hypoxia-induced stc2a mRNA expression in Hif2a-deficient and wild-type (WT) fish. RNA was isolated and stc2a mRNA levels examined by RT-qPCR, normalized by β-actin mRNA levels.
|
