
Fig. 1
- ID
- ZDB-FIG-260114-16
- Publication
- Jia et al., 2025 - Swimming motions evoke Piezo1-dependent Ca2+ events in vascular endothelial cells of larval zebrafish
- Other Figures
- All Figure Page
- Back to All Figure Page
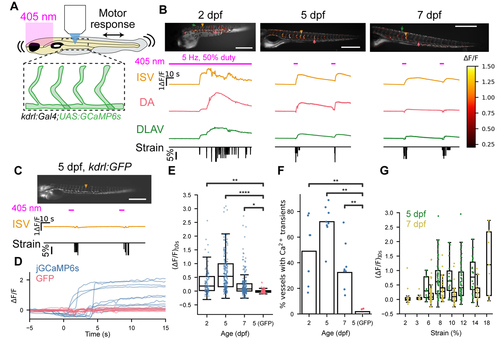
Vascular endothelial cell calcium events arise during swim motions in larval zebrafish. (A) Experimental setup. Violet light on the eyes evoked escape attempts; Ca2+ responses were monitored in vascular endothelial cells. (A) (B) Vascular ECs of larval zebrafish show Ca2+ events at 2, 5, and 7 dpf. Top: composite images of basal fluorescence (greyscale) and ∆F/F 10 seconds after motion onset (heatmap). Bottom: 405 nm stimulus, ∆F/F time-traces of Ca2+ dynamics on intersegmental vessel (ISV), dorsal aorta (DA), and dorsal longitudinal anastomotic vessel (DLAV)31,32, and body strain (Methods). (C) images and traces for Tg(kdrl:GFP) fish as in (B). (D) Comparison of ΔF/F on swim motion in 10 representative vessels expressing jGCaMP6s (blue) or GFP (red). (E) Quantification of ΔF/F 10 seconds after motion onset. Each point is a single vessel measured at a single twitch. (F) Fraction of measured vessels where Ca2+ elevation exceeds 3 standard deviations of GFP ΔF/F, 10 seconds after motion. Each point is an individual fish. (G) Fluorescence response vs body strain at 5 dpf and 7 dpf. Each point is a single vessel during a single twitch. (D – G) Tg(kdrl:Gal4;UAS:GCaMP6s) 2 dpf: 100 vessel-twitch events measured over n = 8 fish, 5 dpf: 179 vessel-twitch events measured over n = 8 fish, 7 dpf: 216 vessel-twitch events measured over n = 9 fish; Tg(kdrl:GFP) 5 dpf: 110 vessel-twitch events measured over n = 5 fish. Statistical tests: (E) mixed-effects linear model considering individual fish and experimental condition. 2 dpf vs. GFP: p = 3.9e-3, z = −2.9; 5 dpf vs. GFP: p = 7.8e-10, z = −6.2; 7 dpf vs. GFP: p = 3.9e-3, z = −2.2. (F) Mann-Whitney-Wilcoxon test. 2 dpf vs. GFP: p = 3.1e-3, U = 45; 5 dpf vs GFP: p = 4.1e-3, U = 40; 7 dpf vs GFP: p = 4.0e-3, U = 40. (H) Spearman correlation, 5 dpf: r = −0.21, p = 0.43; 7 dpf r = 0.64, p = 1.8e-3. Scale bars 500 μm. Additional supporting data in Figure S1. |