FIGURE

Fig. 1

ID
ZDB-FIG-260108-58
Publication
Ahn et al., 2025 - The role of AP2M1 in oncofetal characteristics: integrative in silico, in vitro, and in vivo analyses using zebrafish models
Other Figures
All Figure Page
Back to All Figure Page
Fig. 1

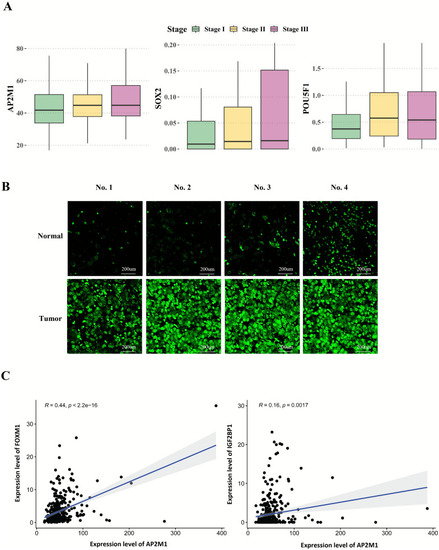
AP2M1 and oncofetal genes are increased in hepatocellular carcinoma patients. A Expression levels of AP2M1, SOX2, and POU5F1 across different stages of HCC in TCGA datasets. The box plots represent the expression distribution of AP2M1 (left), SOX2 (middle), and POU5F1 (right) across Stage I (green), Stage II (yellow), and Stage III (purple) of HCC. BAP2M1 (green) expression levels were confirmed by immunohistochemistry analysis in normal and tumor cells. Images were obtained by confocal microscopy. Photographs are representative of 15 independent experiments. C The scatter plots showed the relationship between AP2M1 expression levels and FOXM1 and IGF2BP1 expression levels. The blue line represents the linear regression fit with the shaded area indicating the 95% confidence interval (CI)

Expression Data

Expression Detail
Antibody Labeling
Phenotype Data

Phenotype Detail
Acknowledgments
This image is the copyrighted work of the attributed author or publisher, and ZFIN has permission only to display this image to its users. Additional permissions should be obtained from the applicable author or publisher of the image. Full text @ Eur J Med Res