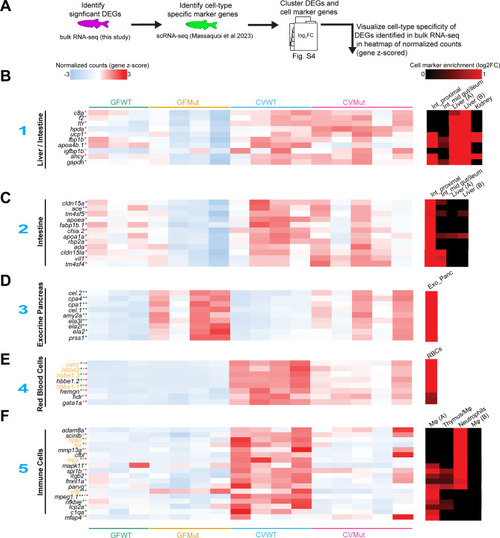
Differentially expressed genes in larval RNA-seq exhibit cell-type specificity. (A) Schematic of application of cell type-specific calls to significant differentially expressed genes (DEGs) in the RNA-seq data set. Significant DEGs were identified and clustered with cell marker genes identified in an scRNA-seq data set generated from the disassociated cells of 6 dpf zebrafish (27). The resulting clustered heatmap is featured in Fig. S4, and the heatmaps below are visualizations of example genes for each cell type. (B) Heatmaps of the gene z-scored normalized counts for diverse cell markers such as the liver/intestine (B), intestine (C), exocrine pancreas (D), red blood cells (RBCs) (E), and immune cells (F). All genes are significant in at least one of the four RNA-seq comparisons (P adjusted < 0.05). The color of the asterisk next to each gene indicates in which comparison(s) the gene is significantly differential (CVMut/GFMut: maroon, CVWT/GFWT: orange, GFMut/GFWT: blue, and CVMut/CVWT: green). Genes in yellow font are significant interaction genes. The blue numbers to the left of each heatmap indicate the cell type cluster the example marker genes represent (Fig. S4). The heatmaps on the far right show the log2 fold change of the indicated gene as a function of cell marker enrichment (27). Abbreviations: int_proximal, intestine_small/proximal; int_mid gut/ileum, intestine mid gut/ileum; exo_panc, exocrine pancreas; Mφ, macrophages.
|
