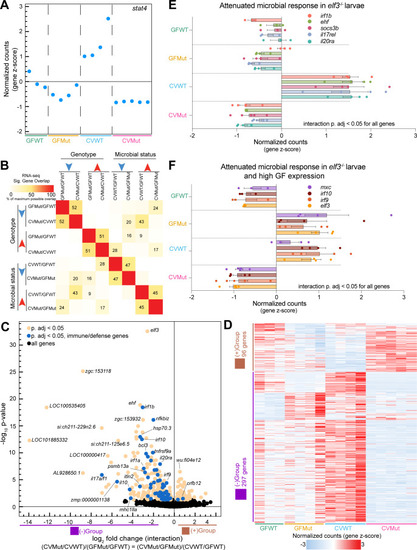
Identification of interaction genes that integrate elf3 genotype and microbial status. (A) Plot of the z-scored normalized counts for significant interaction gene stat4 where each dot represents one replicate for the indicated experimental condition (P adjusted < 0.05). (B) Pairwise comparisons of maximum possible overlap between the significant up- or downregulated genes for each of the four RNA-seq comparisons. (C) Volcano plot depicting the log2 fold change (FC) (x-axis) vs −log10P-value (y-axis) for significant interaction genes identified via likelihood ratio test analysis (P adjusted < 0.05). (D) Heatmap of the z-scored normalized counts for all significant interaction genes. Out of a total of 393 genes, 96 genes have a positive log2FC and 297 genes have a negative log2FC (P adjusted < 0.05). (E) Bar plot of the z-scored normalized counts for genes representative of the attenuated microbial response in elf3 mutant larvae. All depicted genes are significant interaction genes (P adjusted < 0.05). (F) Bar plot of the z-scored normalized counts for example immune response genes that fail to be microbially induced in elf3 mutant larvae at a magnitude comparable to wild-type and that additionally exhibit high expression in GF conditions. All depicted genes are significant interaction genes (P adjusted < 0.05).
|
