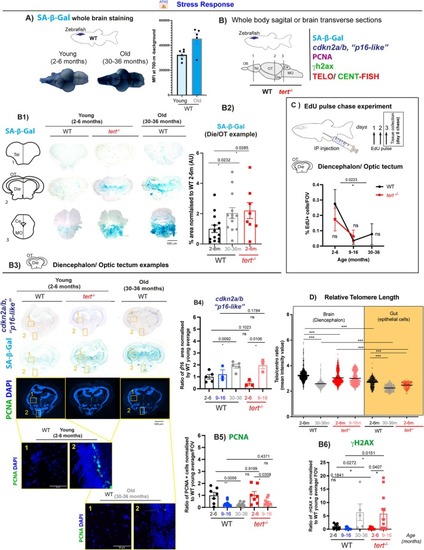
Telomerase (tert) depletion accelerates ageing‐associated stress response in the zebrafish brain. Brain tissue collected from 2–6 months, 9–16 months and 30–36 months WT fish, and 2–6 months and 9–16 months tert−/− fish were used to assess stress response by SA‐β‐Gal staining, cdkn2a/b (‘p16‐like’) RNA expression, proliferation (PCNA and EDU staining), telomere length and DNA damage. (A) Whole brain SA‐β‐Gal staining in young and old WT fish and respective quantification show an increased expression of SA‐β‐Gal in old WT brains compared to young ones. N = 5–6 per group. (B) Schematic figure showing the regions of the brain assessed for senescence‐associated markers. (B1) Representative images of SA‐β‐Gal staining in coronal cryosections of WT and tert−/− zebrafish show that there is an increased expression of SA‐β‐Gal in old WT zebrafish (30–36 months) and that a similar pattern is observed in tert−/− at the young age of 2–6 months, particularly in the diencephalon and optic tectum for which (B2) quantifications are shown. N = 8–14 per group. (B3) Representative images from in situ hybridisation in coronal cryosections, show an increased expression of cdkn2a/b (‘p16‐like’) in WT zebrafish > 30 months optic tectum and diencephalon, in areas where SA‐β‐Gal expression is observed. This increase in p16 expression is already significant at 9–16 months of age in tert−/−. Quantifications shown in B4. N = 3–5 per group. (B3) Representative images of PCNA and γH2AX staining in adjacent sections from zebrafish brain, in coronal cryosections. (B5) Proliferation assessed by PCNA staining show a decrease in proliferation with ageing in both WT and tert−/− fish but this is not accelerated in the absence of telomerase. N = 3–7 per group. (B6) DNA damage response assessed by γH2AX staining show increased DNA damage in WT fish 30–36 months, this increase is accelerated in the tert−/− fish from 9–16 months age. N = 3–7 per group. (C) Similar to what was observed by PCNA staining, proliferation assessment by EdU staining after a 3‐day pulse experiment show a decrease in proliferation with ageing in both WT and tert−/− brains, but this is not accelerated in the absence of telomerase. N = 3–7 per group. (D) Relative telomere length, assessed by telo/cent‐FISH, in longitudinal paraffin sections of zebrafish brain (white) and gut (yellow), show that telomere length decreases with ageing in WT fish (30–36 months) and that this is accelerated in young tert−/− fish (2–6 months). N = 4–5 per group. (A, B2, B4, B5, B6) Each dot represents one animal. (D) Each dot represents one cell. Error bars: SEM. *p < 0.05; **p < 0.01; ***p < 0.001. Abbreviations: OB, olfactive bulb; Tel, telencephalon; Die, diencephalon; OT, optic tectum; Ce, cerebellum; MO, medulla oblongata.
|
